




| Research Article | ||
Open Vet. J.. 2026; 16(7): 4680-4689
Open Veterinary Journal, (2026), Vol. 16(7): 4680-4689 Research Article RNA-seq based transcriptomic profiling of Pesisir cattle with diverse body weightsKhasrad Khasrad1*, Tinda Afriani1, Kusnadidi Subekti1 and Tiara Putri Artha21Department of Animal Technology and Production, Faculty of Animal Science, Universitas Andalas, Padang, Indonesia 2Doctoral Student, Animal Science Study Program, Faculty of Animal Science, Universitas Andalas, Padang, Indonesia *Corresponding Author: Khasrad Khasrad. Department of Animal Technology and Production, Faculty of Animal Science, Universitas Andalas, Padang, Indonesia. Email: khasrad [at] ansci.unand.ac.id Submitted: 28/11/2025 Revised: 19/05/2026 Accepted: 08/06/2026 Published: 20/07/2026 © 2025 Open Veterinary Journal
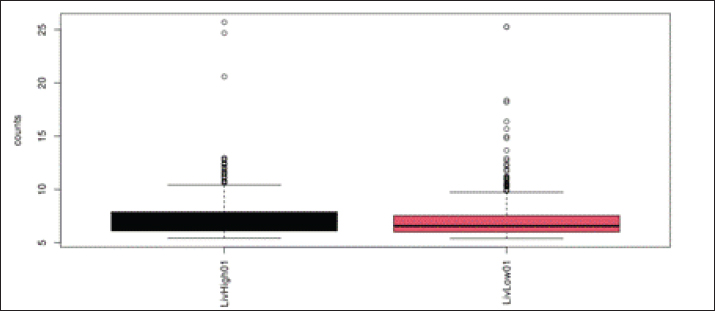
AbstractBackground: Pesisir cattle are one of the indigenous livestock genetic resources in Indonesia. They have a high capacity to adapt to tropical environments. However, information about their transcriptomic profile is limited. Aim: This study aimed to analyze the liver transcriptomic profile and identify differentially expressed genes in Pesisir cattle with distinct phenotypes (high body weight [LivHigh01] and low body weight [LivLow01]) using RNA-seq technology. Methods: Liver tissue samples were taken from two groups of adult female Pesisir cattle: LivHigh01 and LivLow01. RNA was extracted, and libraries were prepared. Sequencing was performed using the Illumina NovaSeq 6000 platform. Bioinformatics analysis included quality control, read mapping, gene expression quantification, and differential gene expression (DGE) analysis. Gene Ontology (GO) and the Kyoto Encyclopedia of Genes and Genomes (KEGG) were used for variant calling and functional analysis. Results: Gene expression distribution across samples was relatively uniform. DGE analysis identified a limited number of significant genes, predominantly downregulated genes. GO analysis revealed the involvement of genes in immune system processes and responses to stimuli, albeit with limited statistical significance. On the contrary, KEGG analysis identified two significantly enriched pathways, namely, glycosphingolipid biosynthesis and nicotinate and nicotinamide metabolism. Genetic variation analysis demonstrated an increased proportion of missense variants in the LivHigh01 group. Conclusion: Differences in body weight in Pesisir cattle are not driven by global changes in gene expression but rather by the specific regulation of a subset of genes involved in energy metabolism pathways and cellular functions. Keywords: Body weight, Differential gene expression, Liver transcriptome, Pesisir cattle, RNA-seq. IntroductionPesisir cattle represent one of Indonesia’s indigenous livestock genetic resources originating from West Sumatra and play an important role in sustainable livestock production systems, particularly in tropical regions. This breed is well known for its high adaptability to extreme environmental conditions, efficient feed utilization, and disease resistance (Sarbaini, 2004). However, molecular-level studies, especially transcriptomic analyses in Pesisir cattle, remain limited, and the biological mechanisms underlying these advantageous traits are not yet fully understood. The liver is an essential organ that is integral to nutrition metabolism, detoxification, immunological response, and energy homeostasis maintenance. Liver transcriptome analysis is a strategic method for identifying genes and biological pathways involved in physiological regulation and environmental adaptability. Advances in RNA sequencing (RNA-Seq) technology have enabled high-precision gene expression investigation, encompassing the discovery of novel genes, splice variants, and allele-specific expression (Wang et al., 2009; Conesa et al., 2016). RNA-Seq has been widely applied in livestock research to investigate production traits, feed efficiency, and environmental adaptation (Conesa et al., 2016; Cui et al., 2025 ). Despite this, transcriptome data on Pesisir cattle are scarce, underscoring the need for more research to address this knowledge deficiency. This study aimed to investigate gene expression profiles and identify differentially expressed genes in the unique characteristics of Pesisir cattle. Materials and MethodsSample preparationThis study used liver tissue samples from two adult female Pesisir cattle in a nonproductive physiological condition, exemplifying divergent body weight phenotypes. The samples were obtained from individuals with high body weight (LivHigh01) (257 kg) and low body weight (LivLow01) (120 kg) from smallholder farms in the Koto XI Tarusan District, Pesisir Selatan Regency, West Sumatra. Sample collection was conducted at the Bandar Buat municipal slaughterhouse in Padang City. Approximately 20 g of liver tissue was extracted from the central region of the right lobe immediately after slaughter. To maintain the integrity of genetic material, the samples were immediately placed in RNA stabilization solution (RNA Shield, Zymo Research) and maintained at −80°C until further laboratory investigation. All animal handling procedures in this study adhered to relevant animal care and slaughter practices regulatory standards. RNA extractionRNA was extracted using the Direct-Zol RNA Miniprep Kit with two main processes, namely, on-column DNase extension and double elution using nuclease-free water to improve the extraction yield. Tissue homogenization was performed using TRI Reagent® (Molecular Research Center Inc., Cincinnati, OH). The purity, concentration, and integrity of the obtained RNA were tested using Nanodrop 2000, Qubit RNA HS assay, and TapeStation 4150 (Thermo Fisher Scientific, Waltham, MA). The integrity of the RNA was checked with an AGILENT TAPESTATION 4150 (Agilent Technologies Inc., Santa Clara, CA) and then confirmed using 1% agarose concentration (Sambrook and Russell, 2001). Library preparation and sequencingmRNA was enriched from the total RNA using the poly-A enrichment module. The mRNA sample was fragmented and hybridized with helper Adaptor Mix, followed by adapter ligation. cDNA was synthesized using the adapter-ligated RNA, followed by polymerase chain reaction amplification to generate the final library sample. The quality and quantity of the library samples were determined using a tape station and a qubit fluorometer, respectively. Sequencing was conducted for 300 cycles (PE150) using Illumina NovaSeq 6000. Data analysisFiltering was performed using fastp software. Filtered reads from each sample were subsampled to the smallest number of reads across samples using the seqtk software. Sequencing read quality checks were performed using FastQC and summarized with MultiQC software. Transcript quantification for each sample was performed using HISAT2 against the reference genome with all gene features (.gtf) information. Mapped reads were counted using HTSeq. Variant calling was conducted using the mapped reads with the Genome Analysis Toolkit pipeline. Variant annotation was performed using SnpEff. Differential gene expression analysis was performed using EdgeR with dispersion set to 0.1 if no biological replicates were present. Estimate dispersion of EdgeR was performed when replicates with at least two are available. Volcano and heatmap plots were generated by enhanced volcano and pheatmap, respectively. Enrichment analysis of both Gene Ontology (GO) and Kyoto Encyclopedia of Genes and Genomes (KEGG) was performed using clusterProfiler, respectively. Various plots were generated using ggplot2. Ethical approvalAnimal experiments were conducted in accordance with the Republic of Indonesia Law No. 18 of 2009 (section 66), which addresses animal keeping, raising, killing, and proper treatment and care. ResultsQuantification resultThe boxplot of read counts in Fig. 1 demonstrates that the pattern of gene expression among samples is comparatively uniform between LivHigh01 and LivLow01. The median values for both samples are roughly 6–7 (log scale), with comparable interquartile ranges. The smallest values approach 0, and the maximum values attain approximately 20, with numerous outliers ranging to approximately 25. In summary, no evident global variation in gene expression distribution was observed between the two groups.
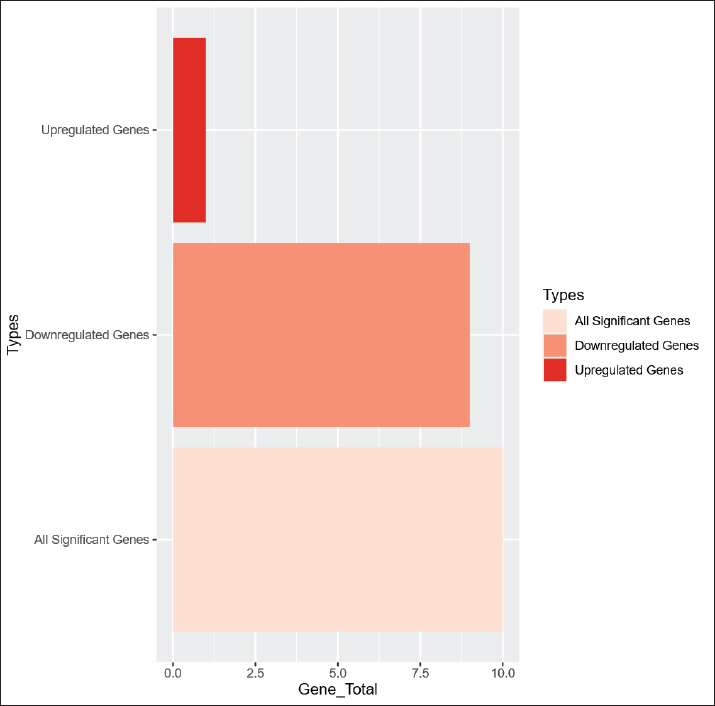
Fig. 1. Boxplot count reads. Clustering analysisThe hierarchical clustering outcomes, depicted as a heatmap in Figure 2, reveal a distinct difference between the LivHigh01 and LivLow01 samples. The heatmap’s diagonal values are comparatively low, whereas the off-diagonal values are elevated. The dendrogram structure reveals that the two samples constitute separate clusters. Variant callingThe results of the variant calling analysis indicated differences in the distribution of genetic variations between LivHigh01 and LivLow01 (Fig. 3). Variations in LivLow01 were primarily situated in intergenic regions, including roughly 60%–65%, followed by synonymous variants (20%–25%) and missense variants (10%–15%). Conversely, LivHigh01 demonstrated a reduced percentage of intergenic variations (50%–55%), with synonymous variants accounting for roughly 25%–30% and missense variants rising to approximately 15%–20%. Frameshift variations were identified at minimal frequencies in both samples. Fig. 3. Variant calling. Differential gene expression (DGE)The DGE study results revealed that the quantity of significantly different genes between LivHigh01 and LivLow01 was comparatively restricted. Out of the 694 genes examined, only a limited selection satisfied the significance criterion, exhibiting |log₂ fold change| values between around ±2.5 and ±3.5, and p-values ranging from 0.001 to 0.01. Downregulated genes were more prevalent than upregulated genes. Figure 4 displays the DGE analysis outcomes.
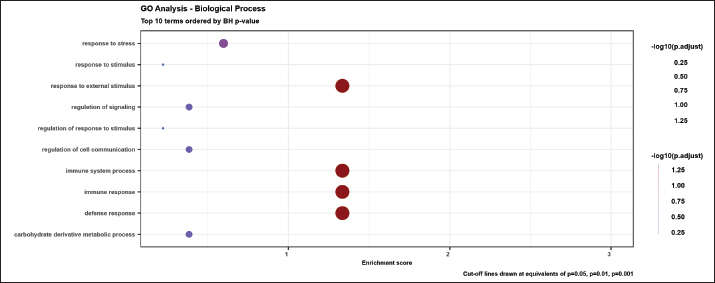
Fig. 4. Differential gene expression. GO enrichmentBiological process (BP)As illustrated in Figure 5, the identified genes were primarily associated with biological processes such as immune response, defense response, response to stimulus, and stress response. Involvement in metabolic processes, including glucose derivative metabolism, was also observed. The enrichment ratings varied from low to high, exhibiting minimal statistical significance.
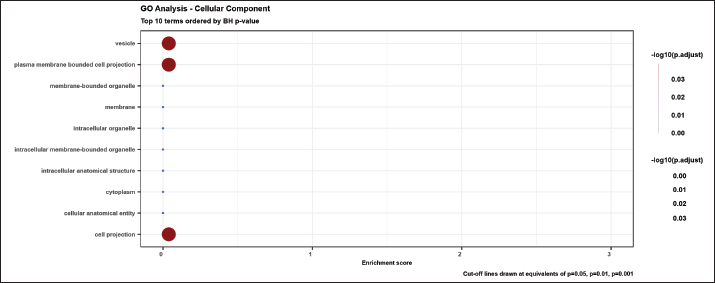
Fig. 5. Gene Ontology enrichment: biological process. Cellular component (CC)No notable enrichment was detected for particular cellular components. The enrichment scores approached 0, with –log₁₀(p.adjust) values ranging from 0.00 to 0.03. Terms such as vesicle, plasma membrane-bounded cell projection, and cell projection exhibited comparatively elevated values; yet, they maintained a low degree of statistical significance. Figure 6 displays the GO enrichment analysis results for cellular components.
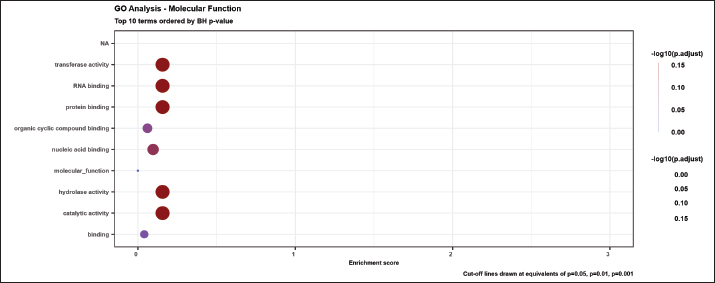
Fig. 6. Gene Ontology enrichment: cellular component. Molecular function (MF)No significant enrichment was detected for certain molecular functions. The enrichment scores varied from about ±0 to 0.3, while the –log₁₀(p.adjust) values ranged from 0.00 to 0.15. Functions, including transferase activity, RNA binding, protein binding, hydrolase activity, and catalytic activity, demonstrated comparatively elevated values relative to others; still, they were not statistically significant. The results are illustrated in Figure 7.
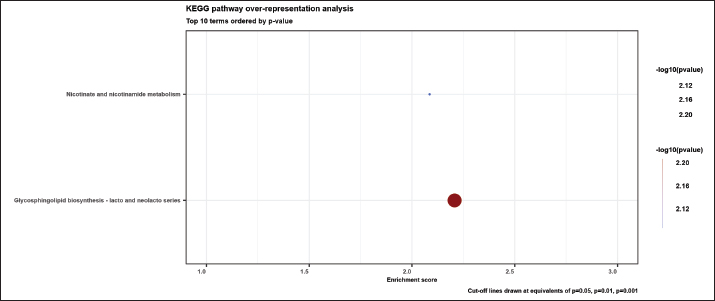
Fig. 7. Gene Ontology enrichment: molecular function. KEGG enrichmentThe KEGG pathway analysis in Figure 8 revealed 2 significantly enriched pathways: glycosphingolipid biosynthesis–lacto and neolacto series, and nicotinate and nicotinamide metabolism. Both pathways exhibited −log₁₀(p-value) values of approximately 2.12–2.20 (p 0.006–0.008), with enrichment scores ranging from approximately 2.1 to 2.3.
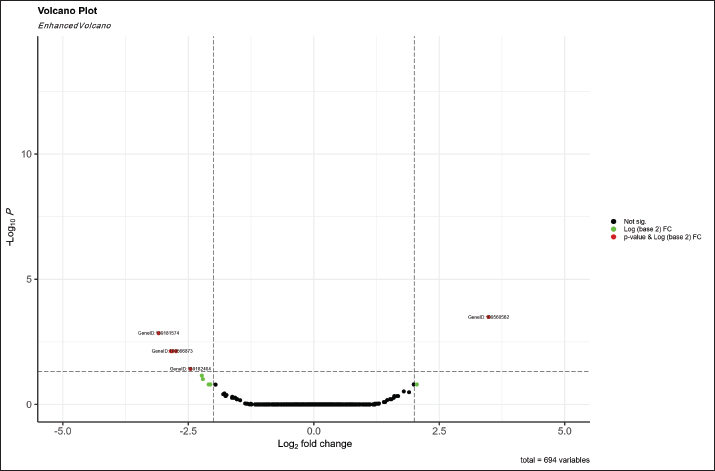
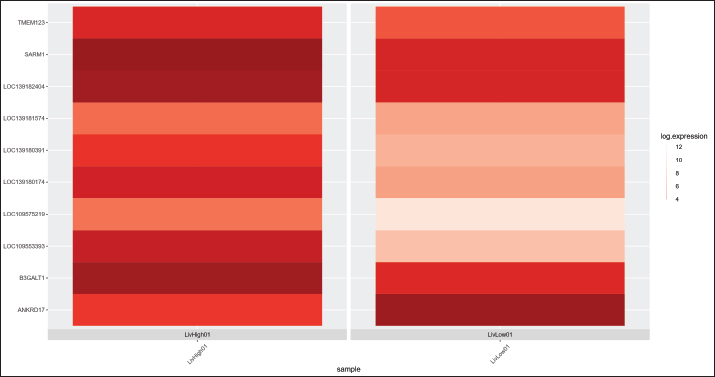
Fig. 8. KEGG pathways. Visualization of the volcano plotThe volcano plot visualization indicates that most genes did not exhibit significant changes in expression, with data points largely concentrated around a log₂ fold change of zero and low −log₁₀(p-value) values. Out of 694 genes, only approximately 4 met the significance criteria, comprising 3 downregulated genes and 1 upregulated gene. These visualizations are presented in Figures 9 and 10.
Fig. 9. Volcano plot.
Fig. 10. Heatmap top 10 up-down genes. DiscussionThe results of this study indicate that differences in body weight in Pesisir cattle are not accompanied by global changes in gene expression but involve only a small subset of significantly different genes. This pattern is consistent with the characteristics of quantitative traits in livestock, where many genes with small to moderate effects and environmental interactions control complex phenotypes such as growth and body weight (Mrode et al., 2019). Transcriptomic studies in cattle have also reported that differences in growth performance are often associated with differential expression of a limited number of key genes involved in metabolism and tissue development, rather than widespread changes across the entire transcriptome (Zarek et al., 2017; Keel et al., 2018). The relatively uniform distribution of gene expression observed in the boxplot indicates good RNA-Seq data quality with minimal technical bias, which is a critical prerequisite for differential gene expression analysis (Conesa et al., 2016). However, the limited number of significant genes is likely influenced by the small sample size, which is known to reduce statistical power in detecting differential expression (Schurch et al., 2016). This condition is common in exploratory RNA-Seq studies with limited biological replication. Despite the relatively limited number of significantly different genes, clustering analysis clearly distinguished the high- and low-body-weight groups. This indicates that even modest alterations in gene expression are sufficient to represent distinct molecular phenotypes between groups. In livestock transcriptomics, a subset of key regulatory genes typically governs complex traits such as growth and feed efficiency rather than widespread changes across the entire transcriptome. Evidence from cattle studies indicates that RNA-Seq analyses of liver and muscle tissues can successfully identify candidate genes associated with growth efficiency, even when only some genes show differential expression. Moreover, the number of differentially expressed genes can vary among studies, yet the biological mechanisms underlying phenotypic variation are still reliably captured (Higgins et al., 2019). GO analysis indicated that the identified genes are primarily involved in biological processes related to the immune system and responses to external stimuli. This finding is consistent with previous transcriptomic studies in cattle, which have demonstrated that immune-related pathways are frequently associated with metabolic efficiency and production performance differences (Salleh et al., 2017). In particular, RNA-Seq analyses comparing cattle with divergent feed efficiency have reported enrichment of biological processes such as immune response and lipid metabolism, suggesting a close relationship between immune function and metabolic regulation (Higgins et al., 2019). Furthermore, the activation of immune-related pathways requires substantial energy, which may influence the allocation of metabolic resources. This trade-off between immune function and growth has been widely reported in livestock, where increased immune activity can reduce growth efficiency due to higher energy demands. Therefore, the enrichment of immune and stimulus-response processes observed in this study may reflect underlying differences in energy use and physiological adaptation between the high- and low-body-weight groups. The KEGG pathway analysis revealed that nicotinate and nicotinamide metabolism and glycosphingolipid biosynthesis are key pathways differentiating the two groups. The nicotinate and nicotinamide metabolism pathway is closely associated with NAD⁺ regulation, a central cofactor involved in redox balance, energy metabolism, and mitochondrial function (Covarrubias et al., 2021). NAD⁺ plays a crucial role in fundamental metabolic pathways, including glycolysis, the tricarboxylic acid cycle, and oxidative phosphorylation. Efficient energy metabolism plays a crucial role in determining growth performance and feed efficiency in cattle, as key metabolic pathways in the liver regulate energy utilization and nutrient partitioning (Alexandre et al., 2015; Mukiibi et al., 2018). The glycosphingolipid biosynthesis pathway plays an important role in cell membrane structure and intracellular signaling. Glycosphingolipids, as sphingolipid components, are involved in cell proliferation, differentiation, and signal transduction (Hannun and Obeid, 2018). These molecules also regulate key cellular functions, such as growth, apoptosis, and immune responses. Lipid metabolism and membrane-associated signaling pathways have been associated with variation in growth performance and metabolic efficiency in cattle (Salleh et al., 2017). The enrichment of these pathways indicates a coordinated interaction between energy metabolism and cellular regulatory mechanisms. NAD⁺ metabolism supports energy production and mitochondrial activity, whereas glycosphingolipids contribute to membrane dynamics and intercellular communication. In cattle transcriptomic studies, such interactions have been reported as key factors underlying differences in growth performance and feed efficiency (Keogh et al., 2016; Salleh et al., 2017). Therefore, the observed KEGG pathways likely reflect the integrated molecular mechanisms contributing to body weight variation in Pesisir cattle. Furthermore, variant calling analysis revealed an increased proportion of missense variants in the high-body-weight group. This type of variation can cause amino acid changes and affect protein structure and function. Genomic studies in cattle have shown that functional sequence variants, including missense mutations, may contribute to phenotypic variation through alterations in biological pathways and protein function (Xiang et al., 2019a,b). These findings indicate that variations in body weight among Pesisir cattle are primarily determined by the precise regulation of key genes related to energy metabolism and cellular activities, rather than extensive changes in gene expression. The integration of gene expression and genetic variation analyses provides insight into the molecular mechanisms underlying this trait, indicating that they are complex yet concentrated within specific biological pathways that have substantial impacts on physiological efficiency and livestock growth. ConclusionThis study concludes that phenotypic variation in body weight in Pesisir cattle is governed by the specific regulation of some key genes and is not correlated with global changes in gene expression across the genome. The nicotinate and nicotinamide metabolism pathway (associated with NAD⁺ regulation) and glycosphingolipid biosynthesis (associated with cellular signal transduction) were identified as the primary biological mechanisms that distinguish high- and low-body-weight groups. In addition, the involvement of immune system processes indicates a potential energy reallocation from growth toward defense mechanisms in certain individuals. The observed increase in the proportion of missense variants in the high-body-weight group provides further evidence that genetic variation at the protein function level contributes to growth efficiency in Pesisir cattle. Overall, these findings reinforce that quantitative traits, such as body weight, are influenced by complex interactions between energy metabolism efficiency and cellular functional regulation in local livestock. AcknowledgmentsThe authors are deeply grateful to the farmers and field staff for their kind assistance during the sample collection process. The authors would also like to thank PT Genetika Science for technical assistance in sequencing and bioinformatics analysis. Finally, we sincerely appreciate the Faculty of Animal Science, Universitas Andalas, for providing the necessary research facilities and administrative support throughout the research process. FundingThis research was funded by the Directorate of Research and Community Service, Directorate General of Research and Development, Ministry of Higher Education, Science, and Technology of the Republic of Indonesia, under the Fundamental Research Scheme – Regular, in accordance with Research Contract Number: 060/C3/DT.05.00/PL/2025, Fiscal Year 2025. Authors' contributionsThe research design and methodology were developed collaboratively. Khasrad supervised the research activities, coordinated the research team, and validated the final manuscript. Tinda Afriani contributed to sample collection and methodological development. Kusnadidi Subekti interpreted the preliminary results and critically reviewed the manuscript. Tiara Putri Artha contributed to sample collection, prepared the manuscript, and coordinated with the sequencing service provider, PT Genetika Science. All authors reviewed, contributed to, and approved the final manuscript before submission. Conflict of interestThe authors declare no conflict of interest. Data availabilityAll data supporting this study’s findings are available within the manuscript. ReferencesAlexandre, P.A., Kogelman, L.J.A., Santana, M.H.A., Passarelli, D., Pulz, L.H., Fantinato-Neto, P., Silva, P.L., Leme, P.R., Strefezzi, R.F., Coutinho, L.L., Ferraz, J.B.S., Eler, J.P., Kadarmideen, H.N. and Fukumasu, H. 2015. Liver transcriptomic networks reveal main biological processes associated with feed efficiency in beef cattle. BMC Genom. 16, 1073; doi:10.1186/s12864-015-2292-8 Conesa, A., Madrigal, P., Tarazona, S., Gomez-Cabrero, D., Cervera, A., Mcpherson, A., Szcześniak, M.W., Gaffney, D.J., Elo, L.L., Zhang, X. and Mortazavi, A. 2016. A survey of best practices for RNA-seq data analysis. Genome Biol. 17(13), 13; doi:10.1186/s13059-016-0881-8 Covarrubias, A.J., Perrone, R., Grozio, A. and Verdin, E. 2021. NAD+ metabolism and its roles in cellular processes during ageing. Nature Rev. Mol. Cell Biol. 22(2), 119–141. Cui, J., Song, L., Wang, D., Liu, Z., Zhang, X., Jia, Z., Zhang, Y., Xiong, H. and Wang, X. 2025. Current status of transcriptome sequencing technology in ruminants. Front. Vet. Sci. 12, 1558799; doi:10.3389/fvets.2025.1558799 Hannun, Y.A. and Obeid, L.M. 2018. Principles of bioactive lipid signalling: lessons from sphingolipids. Nature. Rev. Mol. Cell. Biol. 19(3), 175–191. Higgins, M.G., Cormican, P., McCabe, M.S., Keogh, K., Berry, D.P. and Kenny, D.A. 2019. RNA-Seq analysis of hepatic gene expression in beef cattle with divergent feed efficiency phenotypes. BMC Genomics 20, 413; doi:10.1186/s12864-019-5906-8 Keel, B.N., Lindholm-Perry, A.K. and Snelling, W.M. 2018. Transcriptome analysis of liver tissue from beef steers with divergent growth phenotypes. BMC. Genomics 19(1), 1–12. Keogh, K., Waters, S.M., Kelly, A.K. and Kenny, D.A. 2016. Feed efficiency in beef cattle: a review of the biological aspects of this trait. Anim. Prod. Sci. 56(9), 1399–1414. Mrode, R., Konig, S. and Thompson, R. 2019. Genomic selection in animal breeding. Wallingford, Oxfordshire, UK: CABI Publishing. Mukiibi, R., Vinsky, M., Keogh, K.A., Fitzsimmons, C., Stothard, P., Waters, S.M. and Li, C. 2018. Transcriptome analyses reveal reduced hepatic lipid synthesis and accumulation in more feed efficient beef cattle. Scientific Rep. 8(1), 7303; doi:10.1038/s41598-018-25605-3 Salleh, M.S., Mazzoni, G., Höglund, J.K., Olijhoek, D.W., Lund, P., Løvendahl, P. and Kadarmideen, H.N. 2017. RNA-Seq transcriptomics and pathway analyses reveal potential regulatory genes and molecular mechanisms in high- and low-residual feed intake in Nordic dairy cattle. BMC. Genomics. 18, 258; doi:10.1186/s12864-017-3622-9 Sambrook, J. and Russell, D.W. 2001. Molecular cloning: a laboratory manual. New York, NY: Cold Spring Harbor Laboratory Press, Cold Spring Harbor. Sarbaini. 2004. Diversity of External Characteristics and Microsatellite DNA of West Sumatra Pesisir Cattle Dissertation. IPB University Graduate School Bogor. Schurch, N.J., Schofield, P., Gierliński, M., Cole, C., Sherstnev, A., Singh, V., Wrobel, N., Gharbi, K., Simpson, G.G., Owen-Hughes, T., Blaxter, M. and Barton, G.J. 2016. How many biological replicates are needed in an RNA-seq experiment and which differential expression tool should you use?. RNA 22(6), 839–851; doi:10.1261/rna.053959.115 Wang, Z., Gerstein, M. and Snyder, M. 2009. RNA-Seq: a revolutionary tool for transcriptomics. Nat. Rev. Genet. 10(1), 57–63. Xiang, R., van den Berg, I., MacLeod, I.M., … and Goddard, M.E. 2019. Quantifying the contribution of sequence variants with regulatory and evolutionary significance to 34 bovine complex traits. Proceedings of the National Academy of Sciences (PNAS). 116(39), 19398-19408. https://doi.org/10.1073/pnas.1904159116 Zarek, C.M., Lindholm-Perry, A.K., Kuehn, L.A. and Freetly, H.C. 2017. Differential expression of genes related to gain and intake in the liver of beef cattle. BMC Res. Notes 10(1), 1; doi:10.1186/s13104-016-2345-3 | ||
| How to Cite this Article |
| Pubmed Style Khasrad K, Afriani T, Subekti K, Artha TP. RNA-seq based transcriptomic profiling of Pesisir cattle with diverse body weights. doi:10.5455/OVJ.2026.v16.i7.48 Web Style Khasrad K, Afriani T, Subekti K, Artha TP. RNA-seq based transcriptomic profiling of Pesisir cattle with diverse body weights. https://www.openveterinaryjournal.com/?mno=288515 [Access: July 15, 2026]. doi:10.5455/OVJ.2026.v16.i7.48 AMA (American Medical Association) Style Khasrad K, Afriani T, Subekti K, Artha TP. RNA-seq based transcriptomic profiling of Pesisir cattle with diverse body weights. doi:10.5455/OVJ.2026.v16.i7.48 Vancouver/ICMJE Style Khasrad K, Afriani T, Subekti K, Artha TP. RNA-seq based transcriptomic profiling of Pesisir cattle with diverse body weights. doi:10.5455/OVJ.2026.v16.i7.48 Harvard Style Khasrad, K., Afriani, . T., Subekti, . K. & Artha, . T. P. (2026) RNA-seq based transcriptomic profiling of Pesisir cattle with diverse body weights. doi:10.5455/OVJ.2026.v16.i7.48 Turabian Style Khasrad, Khasrad, Tinda Afriani, Kusnadidi Subekti, and Tiara Putri Artha. 2026. RNA-seq based transcriptomic profiling of Pesisir cattle with diverse body weights. doi:10.5455/OVJ.2026.v16.i7.48 Chicago Style Khasrad, Khasrad, Tinda Afriani, Kusnadidi Subekti, and Tiara Putri Artha. "RNA-seq based transcriptomic profiling of Pesisir cattle with diverse body weights." doi:10.5455/OVJ.2026.v16.i7.48 MLA (The Modern Language Association) Style Khasrad, Khasrad, Tinda Afriani, Kusnadidi Subekti, and Tiara Putri Artha. "RNA-seq based transcriptomic profiling of Pesisir cattle with diverse body weights." doi:10.5455/OVJ.2026.v16.i7.48 APA (American Psychological Association) Style Khasrad, K., Afriani, . T., Subekti, . K. & Artha, . T. P. (2026) RNA-seq based transcriptomic profiling of Pesisir cattle with diverse body weights. doi:10.5455/OVJ.2026.v16.i7.48 |