





| Research Article | ||
Open Vet. J.. 2026; 16(7): 4194-4216 Open Veterinary Journal, (2026), Vol. 16(7): 4194-4216 Research Article Fiber length and its phenotypic role in fleece coverage and genotype-based biotype identification in South American domestic camelidsAlfonso Flores-Gutiérrez1*, Alejandro Prieto2,4, Melina Castillo3, María Flavia Castillo2,4 and Eduardo Narciso Frank51Departamento de Medicina Veterinaria y Zootecnia, Facultad de Ciencias Agropecuarias, Universidad Nacional Jorge Basadre Grohmann, Tacna, Perú 2Facultad de Ciencias Agropecuarias, Universidad Católica de Córdoba, Córdoba, Argentina 3Facultad de Ciencias Veterinarias, Universidad Nacional de La Pampa, Gral Pico, Argentina 4IRNASUS, CONICET-Universidad Católica de Córdoba, Córdoba, Argentina 5Laboratorio de Análisis Clínico y Serológico, sección Genética, Hospital Veterinario, Sede Regional Chamical, Universidad Nacional de La Rioja, La Rioja, Argentina *Corresponding Author: Alfonso Flores-Gutiérrez. Departamento de Medicina Veterinaria y Zootecnia, Facultad de Ciencias Agropecuarias, Universidad Nacional Jorge Basadre Grohmann, Tacna, Perú. Email: afloresg [at] unjbg.edu.pe Submitted: 16/01/2026 Revised: 30/04/2026 Accepted: 08/05/2026 Published: 02/07/2026 © 2026 Open Veterinary Journal
AbstractBackground: Accurate biotype identification in South American domestic camelids (SAC) reared in mixed herds remains a persistent challenge. Phenotypic classifications have been limited by outdated information and an over-reliance on morphological traits, leading to frequent misclassification—particularly in intermediate forms such as the Huarizo (HZ), or when considering whether the Chaku Llama (LCh) biotype may represent an undefined cross with alpaca. Aim: To examine the relationship between fiber length and the extent of fleece coverage in SAC, and to identify potential indicators for genotype-based biotype classification in llamas and alpacas. Methods: A total of 2,027 SAC were sampled from high-Andean peasant communities in the southeast of the Tacna Region, Peru. The following pre-established biotypes were recorded: Huacaya Alpacas (AH, n=1,556); Suri Alpacas (AS, n=25); Intermediate Alpacas (IA, n=31); Huarizos (HZ, n=81); Chaku Llamas (LCh, n=42); Kara Llamas (LK, n=189); and Intermediate Llamas (LI, n=103). Fleece coverage was assessed for the face, neck, extremities, and ears. Fiber samples were collected from the mid-side and analyzed for staple length (SL) (cm), mean fiber diameter (MFD) (µm), coefficient of variation of fiber diameter (%), and prickle factor (PF) (%). ANOVA was applied to continuous variables and contingency tables to categorical data. Results: SL showed consistent and hierarchically ordered differences among all biotypes across two complementary measures, adjusted staple length (SLadj), average fiber length (AFL), with large to very large effect sizes in most pairwise comparisons. MFD and PF did not differ significantly among biotypes, indicating that previously reported quality differences are attributable to age-related effects rather than genetic determinism. Fleece coverage traits—particularly neck coverage—showed significant associations with an SL and demonstrated diagnostic value for biotype differentiation. Conclusion: SL and fleece coverage traits constitute reliable indicators for genotype-based biotype classification in SAC. Their combined use enables more accurate biotype identification, avoiding the misattribution of phenotypic variants to undemonstrated crossbreeding events, as frequently occurs when referring to the Llama LCh biotype. Keywords: Biological types, Fiber coverages, Fiber length, South American domestic camelids. IntroductionAn animal breed refers to a group of animals that share a common ancestry and exhibit distinctive characteristics that differentiate them from other groups within the same species. These characteristics may include reproductive traits, biological types, or appearance and morphological conformation variations. Through their lineage and selectively developed specific traits over time, animal breeds give rise to a consistent and distinguishable set of characteristics. Breeding programs and selection processes are frequently employed to maintain and enhance these unique traits of a given breed. This serves as a basis for classifying and managing distinct intraspecific populations, contributing to both the diversity and the specialization of domesticated animals (Legates and Warwick, 1990). The evolution of the breed or race concept over time and the influence of scientific advances on breed development in South American camelids (SAC) were analyzed in a comprehensive review (Renieri et al., 2008). The impact of domestication on breeds was examined from a genetic perspective, and potential llamas and alpacas were categorized as primary breeds or races. The persistent lack of interest in a scientifically grounded classification has led to the reliance on outdated gray literature, and obsolete information has limited traditional phenotypic classifications. The overemphasis on morphological traits frequently leads to confusion and misclassification, particularly in the evaluation of crossbred or intermediate forms, such as the Huarizo (HZ), or when considering the possibility that the Chaku Llama (LCh) biotype may represent an undefined or unidentified cross with alpaca. Furthermore, the review sought to dispel misconceptions surrounding Suri alpacas (AS), white-coated llama–alpaca animals, and the very notion of pure breeds (Renieri et al., 2008). An additional limitation lies in the age of much of the available literature, as genetic analyses have been largely restricted to studies on fleece type and morphological segregation in llamas (Maquera, 1991; Frank, 2001; Frank et al., 2006a). Most of the older works merely illustrate the limited scientific attention that has been devoted to this type of research during the genomic Era. Their current value is largely restricted to practical field identification of animals based on their phenotypes, and even then, they are only useful in the absence of adequate zootechnical records. In an animal, body size and conformation cannot be separated in biological terms, in the sense that any alteration in the former produces a corresponding alteration in the latter. It is feasible to assume that both size and shape have a genetic basis and that each environmental factor exerts a different weight on the expression of each trait (Dujardin, 2008). In the differentiation of Kara (LK), Intermediate (LI), and LCh, Maquera (1991) placed emphasis on fleece coverage and fiber diameter without attributing particular relevance to fiber length. In a complementary analysis, Chávez (1991) offered a concise synthesis of morphological and productive characteristics—primarily from the perspective of fiber production—and proposed the use of the term variant for their differentiation. However, despite its age, this proposal has never been applied in practice. These variant differentiation criteria exclude fiber length. Although studies on fleece coverage in other species are scarce, Snyman and Olivier (2002) working with South African Merino sheep, reported that the creeping belly score was strongly associated with objective fleece traits. Animals with higher creeping belly scores (better when lower) tended to exhibit finer fiber diameters and longer staples, indicating that this subjective trait is genetically linked to fiber fineness and fleece extension. Bourdon (2013) introduced the concept of biological type or biotype in his classic text on animal breeding, emphasizing the importance of incorporating genotype into the classificatory discussion to accurately identify intraspecific groups. Unlike the traditional breed concept—which has historically privileged morphological and phenotypic criteria—the biotype explicitly integrates genotypic basis as its classification foundation, thereby overcoming the limitations of the conventional descriptive systems employed for SAC. Consequently, the term biotype will be adopted as the reference classificatory category throughout the present study. For SAC, genotypes related to fiber production and morphological characteristics must be considered when defining biotypes. Relevant fiber characteristics in alpacas include mean fiber diameter (MFD), prickle factor (PF), fiber diameter coefficient of variation (CV), and staple length (SL), along with other associated factors; similar traits can be inferred for llamas (Frank et al., 2006a) and Australian alpacas (McGregor, 2006b). The incorporation of genotype into the biological type concept enables a more comprehensive understanding of animal traits, facilitating the design of genetic improvement and selection programs. However, livestock management remains deficient in the southern Peruvian altiplano: llamas and alpacas are frequently maintained in mixed herds, without directed mating and with serious problems of introgression and hybridization (Fernández-Baca, 1994; Kadwell et al., 2001). However, relevant advances have been reported in molecular genetics. Studies on the fibroblast growth factor 5 (FGF5) gene have identified several genetic variants associated with fiber length differences in SAC. In llamas and alpacas, multiple polymorphisms and point mutations have been described that generate premature termination codons, resulting in truncated proteins and a partial or complete loss of the inhibitory function regulating fiber growth in domestic species, with the exception of the Kara biotype (Pallotti et al., 2018; Melo et al., 2023). In contrast, available evidence showed that the FGF5 gene may retain its functionality in wild species, characterized by short fibers (Daverio et al., 2017). Taken together, these molecular findings indicate that the phenotypic differences between short-fibered wild species and long-fibered domestic species are underpinned by variations in the structure and functional activity of this gene. In addition, investigations into seasonal variation in Scottish LK revealed differentiated growth patterns in the length of guard hair (kemp) and undercoat (down), highlighting the influence of shedding and challenging the conventional periodic molt paradigm in mammals (Russell and Redden, 1994). In cashmere goats, which exhibit a classical shedding mechanism, down fiber length is considered an indicator of the fiber growth peak and terminal phase (Merchantt and Riach, 2003). The classification of alpaca biotypes has traditionally relied on the crimp pattern exhibited in their fleece (Bustinza, 1985), despite the fact that AS display a significantly greater SL than Huacaya—approximately 4 cm longer across all age groups (Condorena, 1985). This distinction was subsequently attributed to a genetic mutation associated with luster (L), which influences the fiber growth pattern and alters the inner root sheath structure within the follicle (Frank, 2001). Although more recent research has suggested the involvement of an alternative epistatic gene linked to the primary gene locus, this mutation is governed by a dominant gene (Presciuttini et al., 2010). An intermediate alpaca (AI) occasionally appears when both alpaca biotypes (Huacaya vs. Suri) are mated (Frank, 2001; Flores Gutiérrez, 2020). These difficulties, already apparent in earlier literature, highlight the limitations of relying exclusively on morphological criteria for classification—a challenge that becomes even greater when the entire population is evaluated (Dujardin, 2008). The contrast between older phenotype-based approaches and more recent genetic findings underscores the need to integrate molecular evidence into alpaca biotype classification. Among llamas, two biotypes are traditionally recognized: Kara (LK) and Chaku (LCh). These biotypes are characterized by extensive fleece coverage, extending over the body, neck, and extremities (Vidal, 1967). More recently, an LI type may arise as a result of mating between the two biotypes (Maquera, 1991). A notable distinction is the prevalence of double-coated (DC) fleece in the Kara biotype, together with a shorter SL that requires more than 1 year of growth compared with the Chaku biotype. Morales Zenteno (1997) presented a broader classification of five types of Bolivian llamas, relying almost exclusively on morphological and fleece coverage criteria, with limited reference to productive traits, in a field-based yet important report. Although this remains a preliminary report that has not been scientifically validated, the proposal is presented in a clearer and more structured manner than previous attempts, retaining its originality in terms of practical utility. Genetic and phenotypic evidence showed that fiber length—representing the peak of fleece growth—may be indicative of the degree of fleece coverage on the face, ears, neck, and extremities. This genotype-based trait could better define SAC biotypes than mean diameter or PF, thereby introducing a economic-relevant variable. By analyzing fiber length along with fleece type, the biological and economic significance of genotype-based biotypes in llamas and alpacas was elucidated. As demonstrated by a large-scale population study conducted within the framework of a European Union-funded project that included animals from all countries with SAC presence, phenotypic characterization enables the identification, description, differentiation, and ordering of elements within an animal population (Vinella et al., 2002). Bunge (1998) emphasized that factual science methodology must transcend description and incorporate causal mechanisms to ensure reliable conclusions. This study aimed to examine the relationship between fiber length and the extent of fleece coverage in SAC (llamas and alpacas) to identify potential genotype-based biotype indicators. Materials and MethodsThe characterization of the livestock resource SAC in this study focused on the fiber production systems of llamas and alpacas in high-Andean peasant communities located in the southeast Tacna Region, Perú. A sampling survey was conducted in the study area, where the morphological and phenotypic characteristics of individual animals were recorded, and fiber samples were collected. Study areaThe study area was located in the District of Palca, Tacna Province, within the Tacna Department and Region, Perú. Data were collected from peasant communities composed of smallholder families settled in high-Andean multi-family localities, specifically in the communities of Alto Perú (Annexes: Paucarani and Alto Perú) and Ancomarca (Annexes: Sennca, Río Kaño, Ancomarca Tripartito, and Cueva). These high-Andean localities are established within the high-Andean ecological zone, at elevations between 4,000 and 4,700 m above sea level, between coordinates 17°30' to 17°40' south latitude and 69°30' to 69°50' west longitude (Servicio Nacional de Meteorología e Hidrología del Perú, 2014). The area covers an approximate surface area of 153,635 hectares distributed along the Uchusuma and Maure River watersheds. Its landscape is comparable to that of the communities of Charaña (Bolivia) and General Lagos (Chile). A population of approximately 19,000 domestic camelids has been recorded in the region (DEA, 2013), all of which are distributed across the high Andean localities of the aforementioned Annexes. A total of 2,027 SAC were sampled, comprising 334 llamas, 1,612 alpacas, and 81 HZ. Among the llamas, 189 were classified as the Kara biotype (LK), 103 as the LI biotype (LI), and 42 as the LCh. Within the alpaca population, 1,556, 31, and 25 corresponded to Huacaya Alpacas (AH), 31 to AI, and 25 to AS, respectively. In addition, 81 HZ were included in the study, which are hybrids resulting from unintended mating between a male llama and a female alpaca, presumably derived from crosses between LK and AH. Sampling methodsThe study area was sampled using the technique known as snowball sampling or chain-referral sampling, which is commonly employed in qualitative social research (Biernacki and Waldorf, 1981). In this method, the initial participants—in this case, SAC breeders—refer to other producers with similar characteristics. The process operates as a chain, whereby sampling continues through successive referrals. The first breeder was selected at random, and sampling was continued through successive referrals until the study area was completely covered (Sandoval Casilimas, 2002). A fleece sample weighing between 10 and 30 g was taken from each evaluated animal (llama, alpaca, or HZ) at the tenth rib, midway between the back and the belly (mid-side) (Aylan-Parker and McGregor, 2002). Fleece samples were stored individually in properly labeled polyethylene bags (15 × 30 cm). Subsequently, samples were grouped by production unit and placed in polyethylene bags (66 × 96 cm) to ensure proper handling, transport, and technical preservation. The samples for export were conditioned in accordance with Authorization Note N° 2553/11/00, dated August 27, 2011, issued by the Directorate of International Traffic (SENASA, Argentina), which specified the sanitary requirements for the export of vicuña and alpaca fiber (SENASA, 2011). Each evaluated animal was characterized from an ethnozootechnical perspective by recording the corresponding biotype: AH, AS, HZ, AI, LK, LCh, and LI, following the criteria established by Chávez (1991); Maquera (1991) and the conceptual framework proposed by Bourdon (2013) together with vital statistics including age and sex. External morphological traits, including the frontonasal profile, auricular morphology—shape, size, and tip type—and the degree of fleece coverage across four body regions, were also assessed in accordance with the scale proposed by Vinella et al. (2002): facial coverage was classified as bare (1), tufted (2), or covered (3); ear coverage as bare (1) or hairy (2); neck coverage as fine (1), intermediate (2), or coarse (3); and leg coverage as sockless (1), intermediate (2), or stockinged (3). The productive traits recorded included pigmentation pattern, spot design, fiber color, and nail pigmentation. Fleece samples were processed following the protocol described by Vinella et al. (2002), which comprised an initial scouring stage and classification according to fiber quality criteria—color, style, and fineness. Fleece style was categorized as DC, intermediate coat (IC), single coat (SC), luster (L), and hemi luster (HL) according to Frank (2001) and Frank et al. (2006b). SL was measured as the projected length of a fiber along its axis without stretching or altering the natural crimp, obtained by averaging the lengths of three individual fibers isolated from each mid-side sample. Since SL may not coincide with the mean fiber length after combing [Hauteur, average fiber length (AFL)], the latter was estimated using a mathematical function analogous to the TEAM function developed for wool (David, 1992), derived from the midpoint SL on the Baer diagram combined with measured MFD values (McGregor, 2006a). Adjusted staple length (SLadj.) was calculated by correcting SL for the fleece growth period between consecutive shearings. All analytical work was performed at the Animal Fiber Laboratory of the SUPPRAD Network, Faculty of Agricultural Sciences, Catholic University of the Córdoba. Currently the LAFTA Laboratory, IRNASUS, CONICET-UCC. Statistical analysisDescriptive statistics: The mean fiber length was estimated from three measurements—AFL, SL, and SLadj—and is expressed as the arithmetic mean, where n corresponds to the number of samples per biotype. The SD, CV, and SE were used to characterize the variability. The relative percent standard error (RPSE), calculated as the percentage ratio between the SE and the estimated mean, was used to assess the estimation precision. An RPSE ≤10% was considered acceptable and ≤20% admissible, thresholds indicating that the average discrepancy between the estimated mean and the true value is 10% and 20%, respectively (Sokal and Rohlf, 2012). Mean comparisons: The assessed fiber variables—mean diameter, diameter CV, PF, and SL—were analyzed using univariate analysis of variance under a Mixed Model Analysis of Variance (MANOVA). The model included random effects (animals) and fixed effects (location, flock, and thoracic circumference as covariates), without testing interactions due to the limited number of animals in some categories. In certain cases, the fixed effect of age was nested within flocks and growth time within ages; however, the absence of iteration prevented hierarchical nesting within biotypes. When the MANOVA yielded significant results, post hoc mean comparisons were performed using the Di Rienzo, Guzmán, and Casanoves (DGC) test (Di Rienzo et al., 2002). This procedure is based on the multivariate technique of cluster analysis by average linkage, known as the Unweighted Pair-Group Method using Arithmetic Averages (Sokal and Michener, 1958), which classifies objects according to their pairwise distances by averaging all distances between pairs of objects belonging to different clusters. This method produces clusters with similar variances (Milligan, 1980) and has demonstrated broad effectiveness across diverse applications. Effect size measures for mean differences: Given the unbalanced nature of the data and the differences between group variances, effect size measures were incorporated to complement mean comparisons. Three estimators were applied: Cohen’s d, which is appropriate when groups present similar SDs and sample sizes; Glass’s delta, which uses exclusively the SD of the control group and is suitable when SDs differ between groups; and Hedges’ g, which is recommended when sample sizes are unequal and weights the effect size according to the relative size of each sample (Cohen, 1988; Sawilowsky, 2009). Because a direct efficiency comparison among these three estimators is not feasible in the presence of unbalanced sample sizes and heterogeneous variances, all three were applied simultaneously to obtain a comprehensive assessment of the detected differences. The effect size was interpreted in accordance with Table 4 of Cohen, (1988) using the following categories: very small effect size (VSES), small effect size (SES), medium effect size (MES), large effect size (LES), very large effect size (VLES), and huge effect size (HES), compiled from the criteria of Sawilowsky (2009) and Cohen (1988). Six degrees of difference were established, and a frequency was assigned to each degree based on the three SL variables (SL, SLadj., and AFL), taking the total number of comparisons performed (n=63) as the reference. Table 1. Significance (p-values) of main effects on fiber characteristics of SAC.
Table 2. The mean comparison of different SL measures in relation to morphological characteristics (coverage) identified by the mixed model ANOVA.
Table 3. Comparison of different variables of fiber lengths measured in relation to SAC biotypes.
Table 4. Mean comparisons and effect size of different SL measures by biotype.
Paired t-test and SL ratios: Paired t-tests were applied to contrast the hypotheses of equal means between the following variable pairs: AFL versus SL, AFL versus SLadj, and SL versus SLadj. The SL ratios (SL/AFL, SLadj./AFL, and SL/SLadj.) and correlation coefficients within each pair were calculated. The paired t-test enables the evaluation of mean equality when observations originate from pairs of distinct distributions, based on a sample of size n composed of paired observations in which each member belongs to a different distribution. The test statistic was derived from the distribution of the differences between pairs (d). Contingency tables: The association between the frequencies of morphological variables and fleece types with respect to the expected biotype designations was analyzed using contingency tables. Within each table, Cramér's correlation coefficient, Pearson's chi-square test, and the maximum likelihood chi-square test (ML G²) were evaluated, accompanied by the row percentage with adjusted residual significance indicated for levels <0.05, <0.01, and <0.001. Standardized residuals were expressed as squared standardized residuals in percentage, using the property that their sum is equivalent to the chi-square statistic; expressed as a percentage, they represent the contribution of each cell to the total variance, analogously to variance components. These values were used individually and aggregated by rows and columns to quantify each effect’s contribution to the total variance. Cells with a negative Z-score—indicative of a negative association between row and column—are underlined, whereas cells with a positive Z-score—indicative of a positive association—are not (Agresti, 2013). SoftwareAll statistical analyses were performed using the INFOSTAT software (Balzarini et al., 2008). The generalized linear mixed models were implemented following the methods described by Di Rienzo et al. (2009). Additionally, for the interpretation and design of the tests, instructional guidance from Balzarini et al. (2011) and online assistance from the authors of the respective book chapters were personally consulted. Ethical approvalThe Institutional Commission for the Care and Use of Laboratory Animals (CICUAL) of the University of Buenos Aires. ResultsExploring variability among SAC biotypesThe pre-established biotypes of alpacas, llamas, and the HZ crossbreed (female alpaca × male llama) exhibited significant differences in SL and Mean Fiber Diameter Coefficient of Variation (MFDCV), but not in MFDCV or PF (Table 1). Analysis of covariance (ANCOVA) confirmed that age and its continuous growth measure—thoracic circumference—exerted a statistically significant effect on SL, SLadj., AFL, MFD, and PF, but not on the MFDCV. Similarly, the morphological traits of fiber coverage on the face, neck, and legs, auricular morphology—shape, tip, and size—ear fiber coverage, and fleece type were all highly significantly associated with SL, whereas MFD was not significantly associated with SL. These results highlight the differential impact of age and growth metrics on specific traits within SAC biotypes, demonstrating the complex relationship between these variables and the observable phenotypic characteristics in alpaca and llama populations. In this context, it is particularly relevant to focus the analysis on fiber length expressed through its three main variables: SL, SLadj and AFL. SL was significant in relation to fleece types in both llamas and alpacas, a pattern analogous to that observed for AFL and SLadj (Table 2). Pairwise comparisons between SL, AFL, and SLadj. were all highly significant (p < 0.0001), and the relationship between these variables was strong and highly significant in all cases (Tables 2 and 3). The RPSE (the last column of Table 3) was below 10% in all cases—a threshold considered acceptable—a result particularly noteworthy given the existing imbalance among the different biotype variables. The discrepancies in length between SL and AFL were most pronounced in the LCh and AS biotypes, as well as in the L fleece type, indicating that SL is a less reliable indicator of the fiber growth peak in these biotypes and fleece types. The comparison of fiber length variables among SAC biotypes revealed clear, consistent, and hierarchically ordered differences across all evaluated measures (Table 3). A progressive increase in the AFL was observed from llama-type toward alpaca-type biotypes. LK presented the shortest fibers (6.9 ± 1.51 cm), followed by HZ and LI, whose intermediate values (7.6 cm) did not differ significantly from each other. AH exhibited longer fibers (8.3 cm), whereas LCh and AI formed a homogeneous group with values of 8.8–8.9 cm. AS exhibited the greatest mean fiber length (10.8 ± 1.35 cm) and the lowest variability (CV=12.5%), in contrast to Huacaya, which exhibited the highest dispersion (CV=28.5%). The RPSE was consistently low across all biotypes (1.6%–2.7%), confirming the reliability of the obtained estimates. The same hierarchical pattern was reproduced for SL. The shortest staples (6.9 cm) were presented by LK, followed by HZ and LI (8.4–8.9 cm). AH, LCh, and AI formed a group with longer staples (10.2–11.7 cm), while Suri exhibited the highest mean value (16.5 ± 3.25 cm), confirming its distinctive long-staple phenotype. Nevertheless, Huacaya exhibited high internal variation (CV=50.3%), whereas Suri exhibited the greatest length with the lowest variability (CV=19.7%), reinforcing the phenotypic coherence of this biotype. When the lengths were adjusted for the fleece growth period using mixed models (SLadj.), the same hierarchical ordering among biotypes was maintained. LK remained the shortest (6.9 cm), followed by HZ and LI (7.9–8.1 cm), AH (9.1 cm), LCh and AI (9.7–10.1 cm), and Suri (13.2 cm). The CV decreased notably after adjustment, particularly in the LCh and alpaca biotypes, indicating that a substantial portion of the original dispersion was attributable to differences in the fiber growth period rather than to intrinsic biological variability. Fig. 1 visually illustrates these results, comparing HM (AFL) (red circles) and SL (blue triangles) among biotypes, with vertical error bars representing 95% confidence intervals. The letters above each symbol indicate statistically significant differences among biotypes (p < 0.05). Although both variables followed the same general pattern, SL values were consistently higher than AFL values across all biotypes, a difference reflecting the contribution of staple structure to total fiber length. This effect was particularly pronounced in the AH, AI, AS, and LCh biotypes, where fiber bundling significantly increased staple elongation. SL was ordered in ascending order of fiber length.
Fig. 1. Comparisons of the fibre lengths (as diverse expression) on the different biotypes, within Llama (LK, LI, Lch), HZ and Alpaca (AH, AI, AS) biotypes. HM: AFL, SL: staple length. Finally, the interpretation of mean differences among biotypes was complemented by effect size measures—Cohen’s d, Glass’s delta, and Hedges’ g—whose simultaneous application is particularly appropriate given the marked imbalance in sample size (AH: n=1,556 vs. AS: n=25) and the heterogeneity of variances among groups. Following the criteria of Sawilowsky (2009) the results were classified into LES, MES, and SES, which allow for a robust assessment of the biological magnitude of the detected differences beyond their statistical significance (Table 4). Differences in magnitude among biotypes: effect size analysisThe joint evaluation of statistical significance and effect size—using Cohen’s d, Glass’s delta, and Hedges’ g—enabled a robust assessment of the biological magnitude of fiber length differences among SAC biotypes, beyond statistical significance per se. In all instances, the mean comparison test for SL—or its alternative length measure—across distinct biotypes consistently yielded statistically significant or non-significant results, evaluated through linear mixed models with the DGC test, which controls type I error under unequal sample sizes. No significant differences in variances were obtained despite the marked differences in sample size among a priori assigned biotypes, and the effect size estimators demonstrated robustness in the comparison of true means, even under extreme disparities in the number of animals per biotype (Table 4). When the mean comparisons and effect size were simultaneously large, the convergence of statistical significance, practical significance, and effect magnitude reinforced the robustness of the detected differences among biotypes. For SL, 66.67% of the comparisons yielded a LES, distributed as (LES: 23.81%), (VLES: 28.57%), and (HES: 14.29%). This proportion was even greater for AFL, which presented lower variation among means, with 76.19% of comparisons yielding a (LES: 28.57%, VLES: 33.33%, and HES: 14.29%) (Table 4). Comparisons with a MES represented 23.81% of the total in SL and 28.57% in AFL, constituting an intermediate category in which differences among biotypes are detectable, albeit of lesser practical magnitude than those described above (Table 4). At the opposite extreme, the convergence of both criteria indicates that the observed differences lack both statistical and practical significance when mean comparisons were not significant, and the effect size was small, reinforcing the interpretation of biological similarity between the compared biotypes for that variable. This scenario corresponded to only 9.52% of the comparisons in both SL and AFL. In both variables, cases with a SES were identical, and no cases of VSES were recorded, demonstrating that the majority of SAC biotypes present fiber length differences with demonstrable practical relevance (Table 4). Variation in fiber length and diameter among SAC biotypes: staple structure, growth adjustment, and prickle responseSL and AFL across the biotypesThe comparison of fiber length variables across SAC biotypes revealed a consistent hierarchical pattern for both SL and AFL, with statistically significant differences in most pairwise comparisons aligned with biologically meaningful effect sizes (Table 4). For SL, LK significantly differed from LI, HZ, and Huacaya, with MES according to Cohen’s d. Differences between LK and AI and LCh were highly significant with LES, whereas the effect size between LK and Suri was very large. Notably, pairwise comparisons among LI, HZ, and AH were not statistically significant; however, effect sizes remained detectable (SES for HZ and MES for AH), confirming that the marked differences in group size (n=103, 81, and 1,556, respectively) did not compromise the quality of mean comparisons under the DGC procedure (Aoki, 2020). Similarly, among AH, AI, LCh, and AS, the mean differences were highly significant with LES to MES, further confirming the robustness of comparisons despite extreme imbalances in sample size (n=1,556, 31, 42, and 25, respectively) (Table 4). For AFL, values in LK were comparable to those of SL; however, AFL was progressively lower than SL in biotypes with greater staple elongation—particularly AI, LCh, and AS. The mean differences followed the same general significance pattern as SL, except that no significant difference was detected between AI and LCh. Overall, the effect sizes were smaller but equally consistent across AFL and SLadj. Relative to SL, attributable to the lower SDs of these variables compared with SL. This reduced dispersion is visually evident in the narrower 95% confidence interval whiskers for AFL relative to SL in Fig. 1 (Table 4). SL as an indicator of fiber coverage traitsWhen the growth period and/or age of the animal is known, SL constitutes a reliable indicator of the fiber growth peak, and its magnitude is reflected in the degree of fiber coverage across body regions. As shown in Table 2, neck coverage type, leg coverage, head coverage type, and auricular morphology—including shape, tip form, and size—were all significantly associated with SL measured at the mid-side sampling point. However, although phenotypically expressive in relation to biotype identity, ear size was not significantly associated with SL, suggesting that this auricular trait is governed by genetic determinants independent of fiber growth dynamics. Paired comparisons among fiber length measurementsThe paired mean differences, correlation coefficients, and SL ratios between AFL, SL, and SLadj are summarized in Table 5. Across the SAC biotypes. Paired comparisons revealed highly significant differences (p < 0.001) between AFL and SL and between AFL and SLadj. for nearly all biotypes, indicating that staple formation consistently increases the apparent fiber length relative to individual fiber measurements. The differences between SL and SLadj. were mostly non-significant, confirming that the adjustment for growth time does not substantially alter the relative ranking of biotypes. The magnitude of mean differences increased progressively from Kara (0.60 cm) to Suri (5.04 cm), reflecting the greater degree of fiber cohesion and staple elongation characteristic of the latter biotype. Table 5. Paired mean comparisons between the SL groups. SLadj and AFL as assessed by biotpyes.
Correlations among the three length variables were uniformly strong and positive across all biotypes (r=0.86–0.98; p < 0.001). The highest correlations (r=0.98–0.99) were observed in AS, LCh, and AI, indicating particularly tight fiber–staple relationships in these biotypes (Table 5, second column). SL ratios (SL/AFL and SLadj./AFL) further reinforced this trend, increasing steadily from Kara (1.09–1.10) to Suri (1.48–1.50), demonstrating that staple elongation relative to individual fiber length progressively increases in alpaca-type biotypes (Table 5, third column). The mean ratios across all biotypes were 1.23, 1.25, and 1.00 for SL/AFL, 1.25 for SLadj./AFL, and 1.00 for SL/SLadj., respectively, confirming the stability and consistency of the growth-time adjustment procedure. MFD and PF across biotypesContrary to the widespread assumption that llama biotypes inherently produce coarser fibers with greater prickle potential, the MANCOVA results confirmed that neither the MFD nor the PF differed significantly among the SAC biotypes (p > 0.05; Table 1, columns 8). Both LCh and LK exhibited a lower frequency of fibers exceeding 30 µm; nevertheless, no significant differences in diameter were detected between alpaca and llama biotypes. Both traits were primarily influenced by animal age, expressed as thoracic circumference in the covariate model. Given that PF is defined as the frequency of fibers above 30 µm, it is inherently linked to MFD and consequently follows the same non-significant pattern among biotypes, as verified in Fig. 3.
Fig. 3. Smoothed adjustments of PF (%) on MFD, discriminated by biotypes. Horizontal line indicates frequency of PF detected in fabrics by panelists. Vertical line indicates fibre diameter where the exponential increase of PF occurs (breakpoint). Fig. 3 illustrates the smoothed relationship between PF (%) and MFD across SAC biotypes, revealing a threshold-dependent response pattern. Below approximately 23 µm, all biotypes maintained negligible prickle values below approximately 23 µm, remaining below the 3.2% perceptibility threshold identified by fabric sensory panels. Beyond this diameter—the point at which fiber stiffness becomes sufficient to mechanically stimulate the skin surface, thereby triggering sensory prickle perception—an exponential increase in prickle response was observed. The rate of increase above this threshold differed among biotypes: Huacaya and Suri exhibited the steepest slopes, indicating greater sensitivity to coarse fiber proportions, whereas LK, LI, and LCh showed more gradual increases, suggesting a lower incidence of objectionable fibers within the suprathreshold diameter range. Exploring the variability of fleece types in SACSL variation across fleece typesConsistent with the pattern observed among biotypes, SL varied significantly with fleece type. DC and IC exhibited the shortest staples, whereas the lustrous forms—HL and L—were approximately twice as long as the remaining three fleece types. SC occupied an intermediate position, being significantly longer than DC and IC but shorter than the L categories. These differences are illustrated in Figure 2. Fig. 2. Comparison of SL by fleece type, independent of biotybes. DC: double coated, CI: intermediate coated, L: lustre, HL: hemilustre. Effect of the biotype × age interaction on SL in llamas and alpacasFigures 4 and 5 illustrate the effect of the biotype-by-age interaction on the SL in SAC. In llamas, the SL was significantly greater at 2 years of age compared with that in the first year of growth (p < 0.05), with the SL increasing with age. Biotypes evaluated at 1 year of age (LK:1, LK:2, and LI:1) recorded values between 5.5 and 6.2 cm (group A), whereas marked increases were observed at 2 years of age, particularly in LI:2 and LCh:2 (9–11 cm), which were assigned to superior groups (B and C). A similar pattern was observed in alpacas (Fig. 5), where 2-year-old biotypes (AH:2, AI:2, and AS:2) presented the highest values (15–17 cm), forming a superior group (B–C), while 1-year-old biotypes (AH:1, AI:1, and AS:1) displayed considerably shorter SLs (5–6 cm), forming a single group (A). Taken together, the results demonstrate a significant increase in SL with age in both llamas and alpacas, albeit with inter-biotypic differences, which demonstrate variability in fiber growth patterns.
Fig. 4. Relationship between SL and ages 1 and 2 within Llama biotypes.
Fig. 5. Relationship between SL and ages 1 and 2 within alpaca biotypes. Association between the fleece types and biotypesThe contingency analysis presented in Table 6 revealed a strong and highly significant association between fleece types and biotypes across both alpacas and llamas (Pearson and maximum likelihood chi-square: p < 0.0001; Cramér's V=0.54), confirming that fleece type is a phenotypically structured trait with diagnostic value and is not randomly distributed among SAC biotypes. Table 6. Contingency tables of SAC biotypes by fleece type.
Fleece-type distribution within alpaca biotypesWithin the Huacaya biotype, SC was the predominant fleece type, occurring at a frequency of approximately 96.8% or higher (p < 0.0001). The residual frequencies of DC: 0.0% and (IC: 0.2%) were both highly significantly negative, indicating a near-zero probability of observing these coat types within AH and suggesting that their occasional occurrence is most plausibly attributable to misidentification of animals at the time of sampling. Although AH constituted the largest biotype in the studied population (76.8% of total SAC), its contribution to the total variance in fleece type—expressed as the sum of squared standardized residuals—was only 3.1%, reflecting the extreme homogeneity of this biotype with respect to coat type. Similarly, the AI biotype accounted for a negligible share of the total variance (3.3%). At the opposite extreme within the alpaca group, Suri showed a significantly higher frequency of HL and L fleece types (p < 0.0001), while SC was recorded at 0% frequency with a highly significant negative adjusted residual, indicating that SC is virtually absent from this biotype. Despite its small population size relative to AH, the AS biotype accounted for 32.2% of the total variance in fleece type, reflecting its distinctive and highly structured coat phenotype. The AI biotype, theoretically positioned between AH and AS, did not show a clear predominance of any single fleece type. Both L and SC presented positive and highly significant adjusted residuals, suggesting that AI does not conform to a simple intermediate phenotype but retains phenotypic elements of both parental biotypes. Fleece-type distribution within llama biotypesAmong the llama biotypes, LCh was predominantly characterized by IC: 80%, with a minor but detectable presence of SC (≤11%, interpreted from the negative adjusted residual as an upper frequency boundary). Despite its relatively small population size (n=42), LCh accounted for 17% of the total variance in the fleece type—a proportion substantially higher than that of AH (3.1%)—underscoring the phenotypic distinctiveness of this biotype with respect to coat structure. LK was strongly associated with DC: 82.0%, with SC present at a frequency not exceeding 2.7% (highly significant negative adjusted residual). Although LK represented only 9.5% of the total population, its fleece type accounted for the highest single contribution to total variance (29%), reflecting the rarity yet high diagnostic significance of the DC fleece type within this biotype. The LI, which was theoretically expected to exhibit a fleece phenotype intermediate between LCh and LK, given its presumed origin from crosses between these two biotypes, showed a distribution more closely resembling LK than LCh, with DC being the most frequent type, followed by IC, and SC reaching a maximum frequency of 5.1% (highly significant negative adjusted residual). The contribution of LI to total variance (9.5%) was substantially lower than that of both LK and LCh, consistent with its intermediate and less phenotypically defined character. Overall distribution and total variance contributionSC was the most frequent fleece type across the total SAC population studied (79%). However, when assessed in terms of contribution to total variance—calculated as the percentage of squared standardized residuals—DC showed the highest contribution (46.4%), followed by L (34.1%) and IC (20.4%), while SC contributed relatively little to the overall variance structure despite its numerical predominance. Regarding biotype-level contributions to total variance, LK exhibited the largest share (67.9%), followed by AS (32.2%). Remarkably, AH—the most prevalent biotype in the studied population (76.8%)—only contributed 3.1% to the total variance, a direct consequence of the near-complete association between AH and SC fleece type (96.8%). Minor deviations from this pattern within AH are most likely attributable to biotype misidentification or assignment errors at the time of data collection, representing no more than 3.2% of the total variance. Fleece coverage characteristics and association with SAC biotypesAlthough the fixed effect of facial fiber coverage on SL (SL and SLadj.) was not statistically significant, it was significant for AFL, MFD, and PF (Table 1). The Bare and Tuft categories jointly accounted for 94.9% of observations across the total population, indicating that extensive facial coverage is uncommon in the studied SAC population. At the biotype level, LK accounted for the greatest contribution to total variance in facial coverage (67%), whereas AS contributed negligibly (0.3%). Notably, the facial tuft characteristic of AS is not always readily observable even when present, a limitation that may have influenced the recording of this trait in the current study (Table 8). Table 7. Contingency tables of SAC biotypes by fiber face coverage.
Table 8. Contingency tables of biotypes of SAC by fiber neck coverage frequencies.
Neck fiber coverage showed highly significant frequency distributions across all three categories—fine, intermediate, and coarse—in AH, HZ, and the three llama biotypes (Table 7). Overall, fine and intermediate coverage were the most frequent categories (87.1%), jointly accounting for 95.5% of total variance, whereas coarse coverage remained markedly less common. At the biotype level, LK and HZ combined accounted for the highest proportion of total variance (78.9%), reflecting their phenotypic distinctiveness with respect to this trait. A particularly noteworthy finding is the very low frequency of coarse neck coverage within AH, given that animals of this biotype presented at shows and in promotional contexts consistently display abundant neck fleece. This discrepancy demonstrates that the selection criteria applied in competitive and commercial settings may not be representative of this character’s broader population-level phenotypic distribution. Leg fiber coverage—classified as Sockless (1), Intermediate (2), or Stockinged (3)—has been proposed as a diagnostic trait for SAC biotype differentiation. The contingency analysis presented in Table 9 indicates that the most frequent category across the total population was intermediate coverage, while the highest contribution to total variance was accounted for by socks among the three leg coverage types. Sockless and intermediate coverage were most prevalent in LK, LI, and HZ, whereas the frequency of socks was 6% in AH, with high statistical significance. Leg coverage in AI, AS, and LCh showed a less defined or non-significant distribution within their respective biotypes, demonstrating that this trait has a lower discriminatory power for these particular biotype designations. As observed for neck coverage, the very low frequency of stockinged leg coverage within AH contrasts markedly with the full leg coverage consistently observed in animals of this biotype presented at shows and in commercial promotional contexts, reinforcing the interpretation that competitive selection standards may systematically overrepresent extreme phenotypes relative to their true population-level frequency (Table 9). Table 9. Contingency tables of biotypes of SAC by fiber leg coverage.
Taken together, the patterns observed across facial, neck, and leg fiber coverage converge on two consistent findings. First, the variance in fleece coverage across body regions is disproportionately concentrated in the llama biotypes—particularly LK and also in HZ—rather than in the numerically dominant AH biotype, which exhibits high phenotypic uniformity with respect to these traits. Second, the systematic discrepancy between coverage frequencies recorded in the studied population and those typically displayed in show and commercially selected animals underscores the need to establish biotype descriptors for SAC by distinguishing between population-representative phenotypic characterization and selection-driven phenotypic idealization. DiscussionFiber characteristics defining SAC biotypes: disentangling genetic potential from environmental and age-related effectsThe results presented here challenge long-standing assumptions regarding differences in intrinsic fiber quality between alpaca and llama biotypes. When SACs of different biotypes are reared under equivalent environmental and management conditions, the MFD does not differ significantly among them as a function of genetic origin; rather, the observed differences are primarily attributable to age-related effects, which extend equally to the PF (Table 1, Fig. 3). This finding directly questions the premise advanced by Calle Escobar (1982) who attributed markedly lower fiber quality to llamas relative to alpacas, a position already contested by Villarroel León (1991) on theoretical grounds. The present data provide empirical support for this reappraisal: under conditions of minimized environmental variation, alpaca and llama biotypes exhibit comparable intrinsic fiber characteristics, suggesting that the historically documented perception of lower fiber quality in llamas is more plausibly explained by differences in management conditions, age structure at sampling, or systematic sampling bias than by inherent genetic inferiority. These findings have important implications for both biotype characterization and breeding program design in SAC. The conflation of phenotypic expression—shaped by growth trajectories and environmental conditions—with true genetic potential has likely contributed to the undervaluation of llama fiber in both scientific and commercial contexts. Accurately distinguishing between these two sources of variation is therefore essential not only for a rigorous ethnozootechnical description of SAC biotypes but also for the development of selection criteria that reflect each biotype’s genuine productive potential rather than management or sampling methodology artifacts. In this regard, the use of thoracic circumference as a continuous covariate for age in the MANCOVA model proved effective in partitioning age-related variation from biotype-associated genetic effects, a methodological approach that should be considered in future comparative studies across SAC populations. Variability of fiber length measurement, adjustment methods, and genetic basis of biotype definition in SACTable 3 and Fig. 1 demonstrate a consistent gradient of increasing fiber length from llama to alpaca biotypes, with hybrid and intermediate forms occupying transitional positions. This pattern remained stable across all three fiber length measures—AFL, SL, and SLadj—underscoring the robustness of biotypic differentiation in fiber length within SAC. Notably, LCh approached the alpaca range in fiber length, while Suri and Chaku represented the upper end of fiber elongation and uniformity, supported by narrow confidence intervals indicative of high within-biotype consistency. The observed gradient in fiber length across biotypes is consistent with the known role of the FGF5 gene in regulating fiber growth (Daverio et al., 2017; Pallotti et al., 2018; Melo et al., 2023), providing a molecular basis for the productive differentiation documented here across biotypic categories. The analytical challenge posed by the unbalanced sample sizes inherent to real SAC populations—a limitation frequently noted in the statistical literature—was effectively addressed through the combined use of mixed-model ANOVA with semi-nested fixed effects, the DGC mean comparison procedure, and the simultaneous application of Cohen’s d, Glass’s delta, and Hedges’ g as effect size estimators (Aoki, 2020). This methodological framework not only resolved the issue of unequal group sizes but also provided additional comparative power by quantifying the practical magnitude of mean differences independently of sample size, thereby strengthening the biotypic comparisons’ interpretive robustness. The relationship between SL and true fiber length warrants careful consideration, as raw unstretched SL does not always accurately reflect individual fiber length due to the structural contribution of fiber bundling, crimp, and cohesion to apparent staple elongation. As reported by Fish et al. (2003) for wool, the ratio of mean SL to mean top fiber length (Hauteur) averages approximately 1.2:1, a value that ranged from 1.09 in LK to 1.48 in Suri in the present study, reflecting the progressive increase in staple elongation relative to individual fiber length toward the alpaca-type biotypes. Notably, the crimp definition in SAC—even in Huacaya and LCh—is less well defined than that in wool, which introduces additional uncertainty in the direct application of wool-derived correction functions to SAC fiber length estimation. Based on a mathematical function analogous to the TEAM function developed for wool (David, 1992) and derived from the hand array midpoint fiber length on the Baer diagram combined with MFD measurements, the AFL estimation procedure adopted here constitutes a methodologically justified approach to obtaining a fiber length estimate more closely aligned with processing-relevant parameters than raw SL. Figure 2 illustrates the variation in SL among fleece types independent of biotypic effects, revealing a clear gradient from the shortest staples in IC and DC fleeces—which did not differ significantly from each other—through SC at an intermediate length, to the longest staples in L and HL fleeces, which formed a distinct superior group. The narrow 95% confidence intervals observed for most fleece types, particularly L and HL, indicate low within-group variability and confirm that SL increases systematically with the degree of fiber alignment and surface continuity, being shortest in coarse or DC fleeces and longest in lustrous types characterized by higher fiber organization. This pattern is consistent with the known structural differences between DC and SC fleece architectures and reinforces the utility of SL as a discriminant variable among SAC fleece types, complementing its role as a biotypic differentiator. Although all biotypes followed a broadly similar prickle response pattern across the observed range of fiber diameters, the curves largely overlapped, confirming that biotypic variation in prickle response is minimal when compared at equivalent fiber diameters (Fig. 3). Only marginal divergences were clear above the 23 µm threshold, where Huacaya and Suri tended toward slightly higher prickle values, while LK, LI, and LCh exhibited slightly lower responses. These differences remained within the variability expected for fibers of similar mean diameter and were neither large nor systematic across biotypes. Taken together with the MANCOVA results presented in the Results section, these findings confirm that the PF is primarily governed by the MFD —and by the age-related effects that determine it—rather than by biotype-specific fiber characteristics, further reinforcing the conclusion that under equivalent management conditions, llama biotypes do not exhibit inherently inferior fiber quality relative to alpaca biotypes. The broader significance of these findings must be considered within the conceptual framework proposed by Bourdon (2013) who asserted that a biotype must be anchored in an identified genotype associated with a productive or performance-related trait, rather than relying solely on morphological or behavioral descriptors, which introduced a critical refinement to the definition of biotype in animal breeding. This distinction is particularly relevant for SAC, where no formally defined breeds or races exist (Renieri et al., 2008) and biotypic classification has historically been based predominantly on morphological criteria without systematic integration of productive or genetic information. The present study addresses this gap by incorporating SL—a productive trait with a known inheritance mechanism mediated by FGF5—as a core component of biotypic characterization, thereby aligning the ethnozootechnical description of SAC biotypes with Bourdon’s genotype-anchored definition. Under this framework, a biotypic designation is justified when differential traits can be attributed to a heritable genetic basis; where differential expression is primarily shaped by identifiable environmental effects—such as the age-related diameter variation documented here—the use of the term ecotype is more appropriate. This conceptual clarification has direct implications for the design of genetic evaluation systems and breeding programs in SAC, shifting the role of biotypes from purely descriptive groupings to functional categories capable of guiding selection strategies oriented toward economically relevant traits, such as fiber quality and fiber growth rate. Biotype definition within llamas, alpacas, and their crosses: morphological, productive, and genetic perspectivesLlama biotypesThe classification of llama biotypes in foundational reference works relied predominantly on morphological observations with limited integration of fiber productive traits, a methodological limitation that partially explains the inconsistencies documented across studies. Bustinza and Sucapuca (1987) described the Chaku biotype as producing fleece of regular fineness and adequate SL with few objectionable fibers and good coverage of the neck and legs, while the Kara biotype was characterized as producing a small quantity of fine, irregular, and scarce fiber with a large proportion of coarse fibers—referred to as bristles. The LI was assigned an intermediate position, with acceptable fineness and a minor proportion of coarse fiber. However, these early descriptions were subsequently challenged by Maquera (1991) who reported a lower incidence of objectionable fibers in LK during the first and second years of age relative to the other biotypes, a finding more consistent with the present study’s non-significant diameter differences. Maquera (1991) observed slower fiber growth in LK during the first year of life and a 30%–40% greater SL in unshorn LI and—especially—LCh animals during the second year relative to LK. This differential growth pattern is consistent with the occurrence of partial summer shedding in the LK biotype (Russell and Redden, 1994) and possibly minor shedding in LI, a phenomenon that would systematically reduce apparent SL in LK relative to the other llama biotypes when measurements are taken at equivalent chronological ages. The comparison of SL across llama biotypes at 2 years of age (Fig. 4) provides visual confirmation of this growth differential and underscores the importance of accounting for growth period when interpreting inter-biotypic comparisons of fiber length in llamas. Melo et al. (2023) proposed the role of the FGF5 gene as a candidate genetic factor underlying the fiber growth difference between LK and LI and LCh, providing a molecular basis for the biotypic differentiation in SL documented in the present study and reinforcing the genotype-anchored biotype definition advocated by Bourdon (2013) as discussed in “Materials and Methods”. Alpaca biotypesIn contrast to the llama literature, classical alpaca biotype descriptions—such as those of Condorena (1985)—identified fleece type and SL as the primary distinguishing characteristics, with comparatively little emphasis on morphological traits such as facial, neck, and leg coverage. This productive-trait-centered approach is consistent with the present findings, in which fleece type and SL were the most discriminating variables among alpaca biotypes (Tables 1 and 3, Figs. 1 and 2). All fleece types described in detail by Frank et al. (2006a) were identified in the present study, and their relationship with SL is documented in Table 1 and Figure 2. Table 3 and Fig. 1 further detail the association between SL and biotype. The markedly greater fiber growth observed in HL and L fleece types within the alpaca group is attributable to the FGF5 gene-mediated L variant associated with these fleece types (Pallotti et al., 2018). This finding positions the Suri biotype—characterized by HL and L fleece—as the alpaca biotype with the greatest staple elongation potential, a productive distinction that is both phenotypically consistent and genetically grounded. The comparison of SL at 2 years of age between Huacaya and the HL and L fleece-type biotypes, illustrated in Fig. 5, provides a direct visual representation of this growth differential and reinforces the utility of SL as a core productive descriptor in alpaca biotype characterization. HZ: phenotypic profile of alpaca–llama crossbreedingThe HZ occupies a phenotypically intermediate position within the SAC biotype spectrum, exhibiting fiber length values comparable to those of LI and AH (Table 3). Its fleece type distribution is dominated by SC, with very low frequencies of IC and DC and a complete absence of lustrous fleece types (HL and L) (Table 6). This profile is consistent with the SC predominance of its most common parental biotype—AH females crossed with LK males, as confirmed by field records in the present study. The facial fiber coverage in HZ closely resembles that of AH, with a predominance of Bare coverage and a minor presence of Tuft (Table 7). The neck fiber coverage was predominantly intermediate (Table 8), as was the leg fiber coverage (Table 9), further reinforcing the phenotypic affinity between HZ and AH for coverage traits. Overall, the phenotypic profile of HZ does not conform to a simple arithmetic intermediate between its parental biotypes across all traits. Rather, it shows a closer alignment with AH than with LK for most fiber and coverage characteristics, with the notable exception of SL, where it approaches the LI range. This asymmetric phenotypic inheritance pattern may reflect the predominant AH × LK cross combination documented in field records. Further investigation through controlled crossing experiments and molecular marker analysis is warranted to disentangle the relative contributions of each parental biotype to the HZ phenotype. Limitations of fleece type classification and SL as a biotypic discriminatorWhile fleece type constitutes a valuable phenotypic descriptor for SAC biotype classification, the present results demonstrate that it does not guarantee accurate biotype assignment across all categories in isolation. This limitation is most evident in the cases of AI, HZ, and LCh, where no significant adjusted residual frequencies were observed in the contingency analysis. It should be noted that adjusted residuals are recommended precisely in datasets with large frequency imbalances among cells (Agresti, 2013)—as is the case here, given the markedly higher absolute frequencies in AH relative to AS and llama biotypes—which makes the absence of significance in these intermediate categories particularly informative: it reflects genuine phenotypic overlap rather than a statistical artifact. Consequently, fleece type alone is insufficient to discriminate these biotypes, and to ensure adequate biotypic resolution in intermediate and crossbreed categories, complementary productive or morphological criteria must be incorporated into classification frameworks. In this context, SL emerges as the variable that best supports biotype classification based on productive and commercially relevant characteristics, as demonstrated across the results of this study (Fig. 1) and reinforced specifically for llama biotypes in Fig. 4 and for alpaca biotypes in Fig. 5. The differential staple growth patterns documented across biotypes—particularly the shorter apparent SL in LK attributable to partial summer shedding (Russell and Redden, 1994)—underline both the discriminatory power and the interpretive complexity of this variable. It is noteworthy that the shedding study by Russell and Redden (1994) remains unreplicated, representing a significant gap in the SAC literature that limits the generalizability of conclusions drawn from growth period adjustments in llama biotypes and warrants targeted replication under contemporary population and management conditions. The biological mechanisms underlying greater fiber growth associated with L fleece types merit specific consideration within this framework. The markedly longer staples observed in L and HL fleece types appear to be attributable, at least in part, to an increased thickness of the inner root sheath associated with the L mutation, which influences fiber growth beyond its well-documented effects on crimp type and frequency (Frank, 2001). This growth-promoting mechanism does not appear to operate through the FGF5 pathway that governs fiber length variation in the other fleece types (Melo et al., 2023), suggesting that a distinct and as yet incompletely characterized molecular mechanism mediates L-associated fiber elongation. This distinction has important implications for the genetic characterization of AS and HL alpaca biotypes, as it implies that the FGF5 genotype alone cannot fully explain the superiority of these biotypes in terms of SL and that additional candidate genes or regulatory pathways controlling inner root sheath development should be investigated in future molecular studies of SAC fiber biology. Fleece coverage as a complementary descriptor for SAC biotype characterizationThe practical requirements of breeders and field technicians to visually differentiate SAC biotypes in production settings highlight the need for a more rigorous analysis of the relationship between fiber growth and coverage of the face, neck, and legs—collectively referred to as fleece coverage. As established in the preceding sections, while SL constitutes the most objective and productive-trait-anchored discriminator among biotypes, fleece coverage traits retain practical diagnostic value in field contexts where instrumental fiber measurements are unavailable, provided their discriminatory limitations are clearly understood. Although not significantly associated with fleece length (Table 1), facial fiber coverage effectively discriminates LK, LI, HZ, and AI biotypes, making it a useful supplementary descriptor for these categories. However, its discriminatory power is markedly limited in other biotypes: within AH, bare facial coverage is significantly predominant, contrasting with the widely held popular image of AH as a fully wool-faced animal—a perception likely shaped by the overrepresentation of heavily covered individuals in shows and promotional contexts, as discussed in “Discussion” of the Results. Facial coverage in LCh and AS showed no significant frequency distribution, rendering it uninformative as a biotypic descriptor for these categories. The morphological distinction in facial coverage between LI—characterized by the absence of facial tufts—and LCh has been previously noted by Maquera (1991) and the present data confirm this observation, suggesting that facial tuft presence constitutes a reliable field marker for differentiating LCh from LI and LK within the llama group. In contrast, no prior studies have systematically evaluated the relationship between facial coverage degree and SL in the alpaca group, representing a gap in the literature that the present study begins to address. The evidence from both llama and alpaca biotypes showed an asymmetry in the utility of facial coverage as a biotypic descriptor. Facial coverage can be partially replaced by SL in llamas as a more objective and quantitatively unambiguous criterion for differentiating LK and LI from LCh, particularly when the growth period is appropriately accounted for. In alpacas, fleece type—SC for Huacaya and L or HL for Suri—provides clearer biotypic differentiation than facial coverage, which adds limited discriminatory value beyond what fleece type already captures. The markedly greater SL of Suri relative to Huacaya—approximately 4 cm across different age classes, with growth rates declining after 4 years of age, consistent with the early but still relevant observations of Condorena (1985)—is clearly visualized in Fig. 1 shows the comparison of biotypes by both SL and AFL, confirming the primacy of fiber length variables over coverage traits as productive biotypic descriptors in alpacas. The sheep analogy provides a useful comparative framework for contextualizing fleece coverage in SAC. In merino sheep, higher creep belly scores—reflecting greater extension of belly wool into the true fleece area—have been proposed as indicators of overall fleece density and coverage extension (Snyman and Olivier, 2002). In SAC, the degree of fleece coverage across body regions may function in an analogous but inverse manner: it captures the spatial extent of fiber growth as an expression of the underlying fiber growth potential of each biotype rather than reflecting fleece density per se. This parallel suggests that fleece coverage scoring systems in SAC could be refined by drawing on the methodological frameworks developed for sheep analogous traits, potentially improving the standardization and reproducibility of coverage assessments across populations and management systems. Neck fiber coverage as a biotypic descriptor: biological basis and discriminatory utilityNeck fiber coverage constitutes one of the most informative visual descriptors for SAC biotype differentiation, as demonstrated by its significant association with SL (Tables 1 and 2) and its ability to discriminate between Huacaya and AS and among llama biotypes. At the biotype level, AH accounted for 19% of the total variance in neck coverage, while LI and LK combined accounted for approximately 30%, confirming that this trait captures meaningful inter-biotypic variation and is not merely a superficial morphological feature. The three neck coverage categories—fine, intermediate, and coarse—reflect distinct underlying fiber growth patterns along the anatomical topographic region of the neck, rather than constituting arbitrary visual classes. Fine and coarse coverage correspond to uniformly short and long SLs, respectively, across the entire neck region. In contrast, intermediate coverage presents a characteristic conical appearance, with a greater SL at the base of the neck progressively decreasing toward the insertion point of the head. This topographic gradient in fiber length along the neck axis is consistent with observations reported in classical but still relevant works by Vidal (1967), Maquera (1991) and Morales Zenteno (1997) suggesting that neck coverage categories capture a biologically grounded expression of the spatial distribution of fiber growth rather than a subjectively assessed visual impression. These findings reinforce the argument developed in “Conclusion” of this Discussion that fleece coverage traits—when properly understood as proxies for the spatial extent and magnitude of fiber growth—provide complementary biotypic information to SL measurements. The strong and significant relationship between neck coverage and SL (Tables 1 and 2) suggests that this trait could serve as a practical field surrogate for SL in contexts where instrumental measurement is not feasible, particularly for the discrimination of llama biotypes and for the Huacaya–Suri differentiation within alpacas. However, as with facial coverage, the population-level frequency distributions documented in this study (Tables 7–9) differ substantially from the neck coverage profiles typically observed in show and commercially selected animals, underscoring the need to base biotypic descriptors on representative population data rather than on phenotypic ideals promoted in competitive selection contexts. Leg fiber coverage as a biotypic descriptor: discriminatory utility and comparative frameworkLeg fiber coverage was significantly associated with SL (p < 0.0001; Table 1), confirming its relevance as a biotypic descriptor in SAC. However, significant pairwise differences were restricted to comparisons between the extreme categories—Sockless versus Intermediate and Stockinged—with no significant difference detected between Intermediate and Stockinged (Table 2), indicating that this trait’s discriminatory power is concentrated at the lower end of the coverage spectrum rather than distributed uniformly across all three categories. It should be noted that the SL in this study was measured at the standard mid-side sampling site on the ribcage and therefore reflects whole-body fiber growth potential rather than the specific fiber length on the animal’s legs. This distinction is relevant when interpreting the association between leg coverage scores and SL measurements. Leg fiber coverage was particularly informative for discriminating among llama biotypes at the biotype level: LK and LI combined accounted for approximately 60% of the total explained variance in leg coverage (Table 6), reflecting the higher prevalence of Sockless coverage in these biotypes relative to the remaining SAC population. In LCh, neither the Z-score nor the adjusted residual reached significance, shows that leg coverage is not a reliable discriminator for this biotype. Within the alpaca group, intermediate coverage was highly significant in both AH and AS, while stockinged coverage—the most extensively woolled leg phenotype—represented only 7% of the total population across all biotypes, confirming that full leg coverage is a rare phenotype in the studied SAC population, contrary to the impression conveyed by show and commercially selected animals. The scarcity of published studies on leg fiber coverage in SAC and other fiber-producing species limits the comparative contextualization of these findings. Cockrem and Rae (1966) addressed fleece coverage in sheep, and Maquera (1991) and Morales Zenteno (1997) provided the most relevant SAC-specific references, although neither systematically quantified leg coverage in relation to SL or biotype classification. The most informative comparative framework is provided by Snyman and Olivier (2002) who demonstrated that the creep belly score—a subjective assessment of the extension of belly wool into the true fleece area—showed strong genetic associations with objective fleece traits in South African Merino sheep, with higher scores associated with finer fiber diameters and longer staples. By analogy, the degree of leg fiber coverage in SAC may reflect an underlying genetic predisposition toward greater fiber growth extension across body regions, potentially governed by the same molecular pathways—including FGF5—that regulate SL differences among biotypes, as discussed in this Discussion. If this hypothesis is confirmed through genetic association studies, leg coverage scoring could be incorporated as a heritable indicator trait in SAC breeding programs, complementing SL measurements and fleece type classification in the genotype-anchored biotype characterization framework proposed by Bourdon (2013). ConclusionThis study provides a comprehensive reassessment of biotype classification in domestic SAC, integrating productive, morphological, and genetic criteria within a unified ethnozootechnical framework. The interspecific distinction between llamas and alpacas, while visually straightforward in purebred animals, becomes substantially less clear in crossbreeds such as the HZ, where phenotypic overlap between species complicates classification and underscores the need for objective, measurable discriminators beyond traditional morphological descriptors. SL—evaluated through three complementary measures (SL, SLadj, and AFL)—emerged as the primary productive trait for biotype differentiation in SAC, owing to its consistent hierarchical discrimination among biotypes, robustness under unbalanced sampling conditions, and grounding in a known genetic mechanism mediated by the FGF5 gene. The present results confirm that the MFD and PF do not differ significantly among biotypes under equivalent management conditions, a finding that challenges the long-standing assumptions of inherent fiber quality inferiority in llama biotypes and attributes the historically observed differences to age-related effects and management artifacts rather than to genetic determinism. This distinction between phenotypic expression and true genetic potential has direct implications for the design of selection criteria and breeding programs in SAC, shifting biotype designations from purely descriptive categories toward genotype-anchored functional classifications in the sense proposed by Bourdon (2013). Fleece coverage traits—facial, neck, and leg fiber coverage—contain valuable complementary descriptors that capture the spatial expression of fiber growth across body regions and retain practical diagnostic utility in field contexts where instrumental fiber measurements are unavailable. Neck coverage, in particular, demonstrated a strong and significant association with SL and proved effective in discriminating among llama biotypes and between AH and AS, whereas facial and leg coverage provided additional discriminatory resolution for intermediate and crossbreed categories where fleece type alone was insufficient. The population-level frequency distributions documented for all three coverage traits differed markedly from the phenotypic profiles typically promoted in show and commercial selection contexts, highlighting the systematic overrepresentation of extreme phenotypes in competitive settings and reinforcing the need to base biotypic descriptors on representative population data. The identification of the FGF5 gene as a regulator of fiber growth differences among SAC biotypes provides a molecular foundation for the productive differentiation documented in this study and opens a research avenue for the integration of molecular genetics into SAC biotype characterization. The distinct growth mechanism associated with L fleece types—mediated by inner root sheath thickening rather than FGF5 activity—suggests that fiber elongation in Suri and Hemi L biotypes involves additional genetic pathways that are yet to be fully characterized. Future research should prioritize the replication of shedding studies in llama biotypes under contemporary population and management conditions, genetic association analysis of coverage traits as potential heritable indicator variables, and molecular characterization of L-associated fiber elongation mechanisms across SAC species and biotypes. Taken together, the findings of this study demonstrate that accurate SAC biotype classification requires the integration of SL, fleece type, and fleece coverage traits within a multidimensional framework anchored in both productive performance and genetic mechanisms. Bridging the gap between phenotypic characterization and genotypic determination has the potential to substantially improve the precision of biotype classification systems, refine selection criteria for economic-relevant traits, and contribute to the long-term sustainability and genetic conservation of domestic SAC diversity. AcknowledgmentsThe authors would like to thank the domestic camelid breeders of the Palca High Andean zone for providing access to their animals and for their cooperation during the study. A sincere acknowledgment to the Animal Fiber Laboratory (LAFTA) of the IRNASUS-CONICET Institute for its contribution to this work. Conflict of interestThe authors declare no conflicts of interest. FundingThis project was funded by the primary author as part of the Master’s Thesis in Animal Production and supported by a PRONABEC scholarship in Is: Perú. Authors' contributionsAll authors contributed to conceptualization, methodology, validation, writing, original draft preparation, review, editing, and visualization. All authors have read and approved the published version of the manuscript. Data availabilityThe data supporting the findings of this study are available from the authors. ReferencesAgresti, A. 2013. Categorical data analysis, Aoki, S. 2020. Effect sizes of the differences between means without assuming variance equality and between a mean and a constant. Heliyon 6(1) , e03306; doi: 10.1016/j.heliyon.2020e03306 Aylan-Parker, J. and McGregor, B.A. 2002. Optimizing sampling techniques and estimating sampling variance of fleece quality attributes in alpacas. Small. Ruminant. Res. 44, 53–64. Balzarini, M., Di Rienzo, J., Tablada, M., Gonzalez, L., Bruno, C., Córdoba, M., Robledo, W. and Casanoves, F. 2011. Estadística y Biometría. Ilustraciones del uso de InfoStat en problemas de agronomía. Córdoba, Argentina: Brujas. Balzarini, M.G., Gonzalez, L., Tablada, M., Casanoves, F., Di Rienzo, J.A. and Robledo, C.W. 2008. Manual del Usuario. Brujas. Biernacki, P. and Waldorf, D. 1981. Snowball sampling: problem and chain referral sampling techniques. Sociol. Methods. Res. 10(2), 141–163. Bourdon, R.M. 2013. Understanding animal breeding, 2nd ed. Prentice-Hall. Bunge, M. 1998. La Ciencia, su método y su filosofía. Buenos Aires, Argentina: Sudamericana. Bustinza, V. 1985. Razas de alpacas del altiplano: suri y wacaya. Puno, Perú: Universidad Nacional del Altiplano. Bustinza, V. and Sucapuca, V. 1987. Situación de las llamas en Puno. Rev. Allpaka. 1(3), 1–15. Chávez, J.F. 1991. Mejoramiento genético de alpacas y llamas. In avances y perspectivas del conocimiento de lo Camélidos sudamericanos, oficina regional FAO. Ed., Fernández-Baca, S. Santiago, Chile: Oficina Regional de la FAO para América Latina y el Caribe, pp: 149–90. Cockrem, F. and Rae, A.L. 1966. Studies of face cover in the New Zealand Romney Marsh sheep. I. The relationships between face cover, wool blindness, and productive characters. Aust. J. Agric. Res. 17(6), 967–974. Cohen, J. 1988. Statistical power analysis for the behavioral sciences, Condorena, N. 1985. Aspectos de un sistema regularizador de la crianza de alpacas. IVITA, La Raya. Daverio, M.S., Vidal-Rioja, L., Frank, E.N. and Di Rocco, F. 2017. Molecular characterization of the llama FGF5 gene and identification of putative loss of function mutations. Anim. Genet. 48, 716–719; doi:10.1111/age.12616 David, H.G. 1992. The relationship between staple length and mean fibre length for wool. In proceedings of IWTO. Technical Committee meeting, report No. 19. DEA. 2013. Anuario estadístico pecuario: población de Alpacas y Llamas en la Región Tacna Dirección Estadística Agraria. Tacna, Perú: Dirección de Estadística Agraria (DEA). Di Rienzo, J.A., Guzman, A.W. and Casanoves, F. 2002. A multiple-comparisons method based on the distribution of the root node distance of a binary tree. J. Agric. Biol. Environ. Stat. 7(2), 129–142; doi:10.1198/10857110260141193 Di Rienzo, J.A., Macchiavelli, R. and Casanoves, F. 2009. Modelos Mixtos en InfoStat. Córdoba, Argentina: Brujas. Dujardin, J.P. 2008. Morphometrics applied to medical entomology. Infection. Genet. Evol. J. Mol. Epidemiol. Evol. Genet. Infec. Dis. 8(6), 875–890. Calle Escobar, R. 1982. Producción y mejoramiento de la alpaca. Lima, Perú: Fondo del Libro del Banco Agrario del Perú. Fernández-Baca, S. 1994. Genetic erosion on camelids. Anim. Genetic Resour. Inf. 14, 7–15. Fish, V.E., Mahar, T.J., Semmel, P. and Dempsey, J.M.A. 2003. The examination of decrimped staple length to differentiate atypical wool types as a potential aid to purchasing and processing prediction. Sidney, Australia: INTERNATIONAL WOOL TEXTILE ORGANIZATION, pp 1–12. Flores-Gutiérrez, A. 2020. Caracterización etnozootécnica de las poblaciones de Camélidos Sudamericanos domésticos en comunidades de la Provincia de Tacna, Perú. Tesis de Maestría en Producción Animal, Universidad de Buenos Aires, Buenos Aires, Argentina. Frank, E.N., 2001. Descripción y Análisis de segregación de fenotipos de color y tipos de vellón en Llamas Argentina. Tesis Doctoral, Universidad de Buenos Aires, Buenos Aires, Argentina. Frank, E., Hick, M.V.H., Gauna, C.D., Lamas, H.E. and Molina, M.G. 2006b. Effects of age class, shearing interval, fleece, and color type on fiber quality and production in Argentine llamas. Small Ruminant Res. 61(2-3), 141–152. Frank, E.N., Hick, M.H.V., Gauna, C.D., Lamas, H.E., Renieri, C. and Antonini, M. 2006a. Phenotypic and genetic description of fibre traits in South American domestic camelids (llamas and alpacas). Small Ruminant Res. 61, 113–129. Kadwell, M., Fernandez, M., Stanley, H.F., Baldi, R., Wheeler, J.C., Rosadio, R. and Bruford, M.W. 2001. Genetic analysis reveals the wild ancestors of llama and alpaca. Proc. Roy. Soc. London. Ser. B. Biol. Sci. 268(1485), 2575–2584. Legates, J.E. and Warwick, E.J. 1990. Breeding improvement of farm animals, Villaroel Léon, J. 1991. Las fibras. In Avances y perspectivas del conocimiento de los Camélidos sudamericanos. Ed., Fernandez-Baca, S. Santiago, Chile: FAO, oficina regional de producción animal, pp: 363–386. Maquera Llano, F.E. 1991. Persistencia fenotípica y caracterización de los tipos de Llama Kara y Lanuda del Centro Experimental La Raya-Puno. Tesis Magister Scientae en Producción Animal, Universidad Nacional Agraria La Molina, La Molina, Is: Perú. Mcgregor, B.A. 2006. Production, attributes, and relative value of alpaca fleeces in southern Australia and implications for industry development. Small. Ruminant. Res. 61(2-3), 93–111. McGregor, B.A. 2006. Relationship between baer diagram hand array length and Almeter length measurements for dehaired cashmere. Int. J. Sheep Wool Sci. 55, 96–105. Melo, C., Bravo, W., Melo, M. and Zapata, C. 2023. Relación del gen FGF5 con la longitud de las fibras de los camélidos sudamericanos. Rev. Investig. Vet. Perú. 34(4), e24005; doi:10.15381/rivep.v34i4.24005 Merchantt, M. and Riach, D.J. 2003. Changes in skin and fleece characteristics of Scottish cashmere goats following selection for increased annual production and decreased fibre diameter. Anim. Sci. 76(3), 517–522; doi:10.1017/S1357729800058732 Milligan, G.W. 1980. An examination of the effect of six types of error perturbation on fifteen clustering algorithms. Psychometrika 45(3), 325–342; doi:10.1007/BF02293907 Morales Zenteno, R. 1997. Tipos de Llama en el altiplano boliviano (Ed.). Oruro, Bolivia: UNEPCA-FIDA_CAF. Pallotti, S., Pediconi, D., Subramanian, D., Molina, M.G., Antonini, M., Morelli, M.B., Renieri, C. and La Terza, A. 2018. Evidence of post-transcriptional readthrough regulation in FGF5 gene of alpaca. Gene 647, 121–128; doi:10.1016/j.gene.2018.01.006 Presciuttini, S., Valbonesi, A., Apaza, N., Antonini, M., Huanca, T. and Renieri, C. 2010. Fleece variation in alpaca (Vicugna pacos): a two-locus model for the Suri/Huacaya phenotype. BMC. Genet. 11, 70; doi:10.1186/1471-2156-11-70 Renieri, C., Frank, E.N., Rosati A. and y Macias Serrano, J.A. 2008. El concepto de raza en zootecnia y su aplicación a la llama y a la alpaca The breed notion in animal science and its application to llama and alpaca. In South American camelids research. Wageningen Academic Publishers; doi:10.3920/978-90-8686-648-9_024 Russel, A.J.F. and Redden, H. 1994. Nutritional and seasonal effects on fibre production in llamas. In Proceedings of the British Society of Animal Production (1972), Cambridge, Reino Unido, Cambridge University Press, p 217; doi:10.1017/S0308229600027616 Sandoval Casilimas, C.A. 2002. Investigación Cualitativa. Especialización en Teoría, Métodos y Técnicas de Investigación Social. Bogotá, Colombia: Instituto Colombiano para el Fomento de la Educación Superior. Sawilowsky, S.S. 2009. New effect size rules of thumb. J. Mod. Appl. Stat. Methods. 8, 597–599; doi:10.22237/jmasm/1257035100 Servicio Nacional de Meteorología e Hidrología del Perú. 2014. Memoria anual 2014. Lima, Perú: Servicio Nacional de Meteorología e Hidrología del Perú. Available via https://www.senamhi.gob.pe/ Servicio Nacional de Salud Animal y seguridad alimentaria (SENASA). 2011. Importación de fibra de Camélidos Sudamericanos. Research 2553/11/00, 1–2. Snyman, M.A. and Olivier, W.J. 2002. Correlations of subjectively assessed fleece and conformation traits with production and reproduction in Afrino sheep. S. Afr. J. Anim. Sci. 32(2), 88–96. Sokal, R. and Rohlf, J. 2012. Biometry: the principle and practices of statistics in biological research, Sokal, R.R. and Michener, C.D. 1958. A statistical method for evaluating systematic relationships. Univ. Kans. Sci. Bull. 38, 1409–1438. Vidal, S.O. 1967. La crianza de la Llama y algunas características de su fibra. Tesis Ingeniero Zootecnista. Universidad Nacional Agraria, La Molina, Perú. Vinella, S. Virdis, M.R., Antonini, M. and Iannetta, M. 2002. SUPREME-project: sustainable production of natural resource and management of ecosystems: the potential of South American camelid breeding in the Andean region. First Advance Report. Wageningen, The Netherlands: European Union- General Secretariat XII- INCO System, pp 2–6. | ||
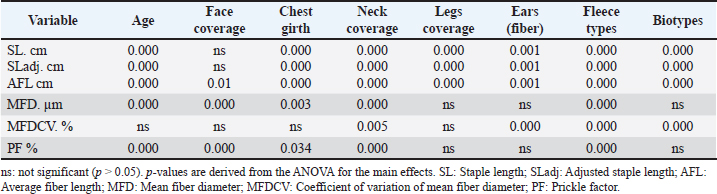
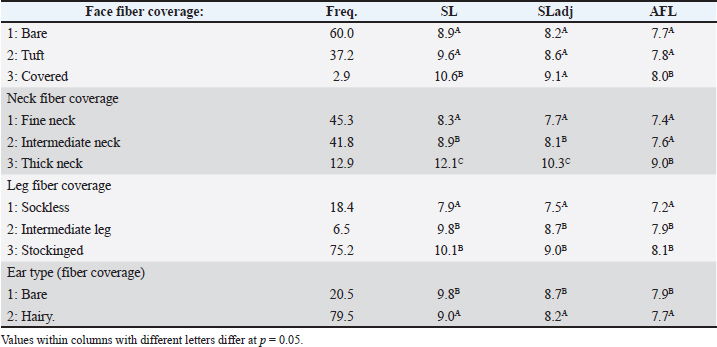
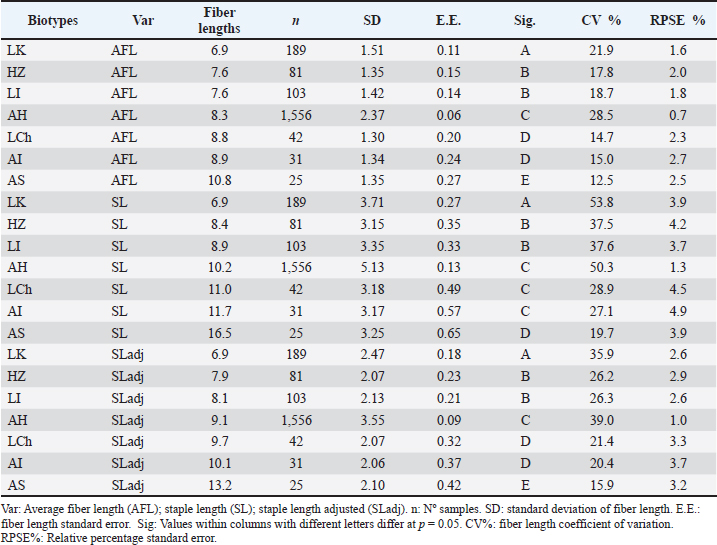
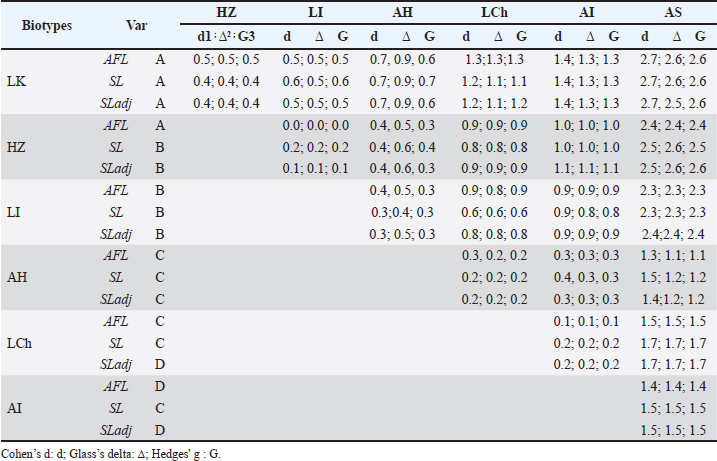
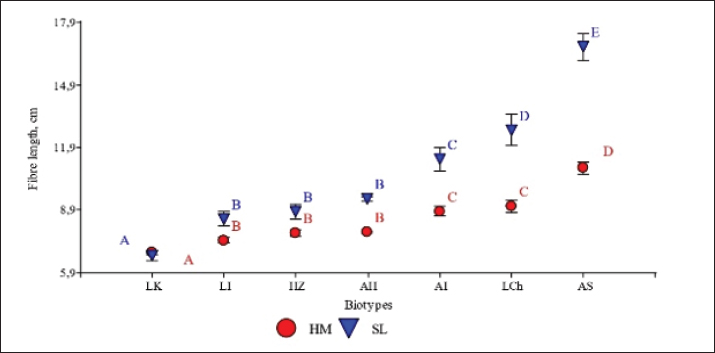
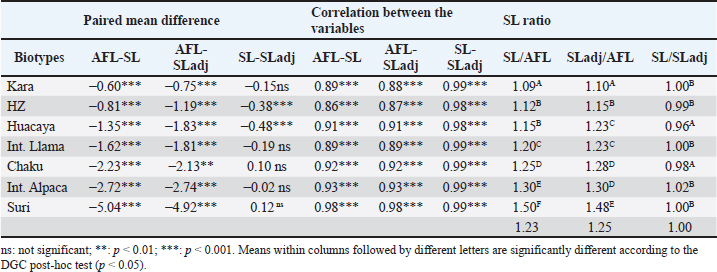
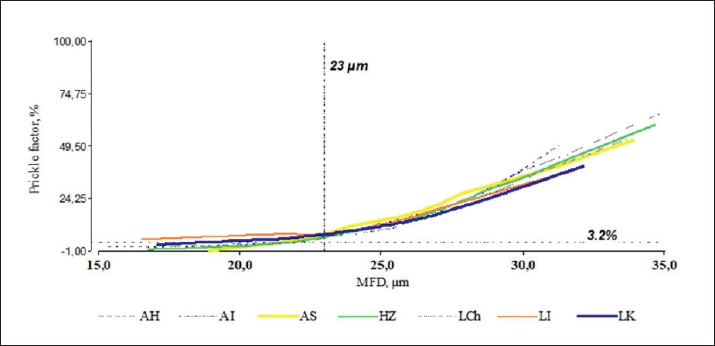
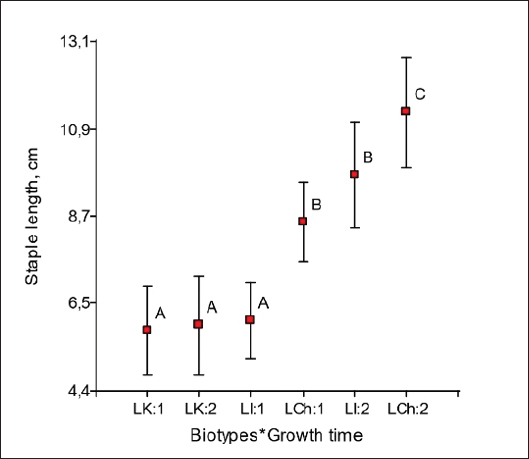
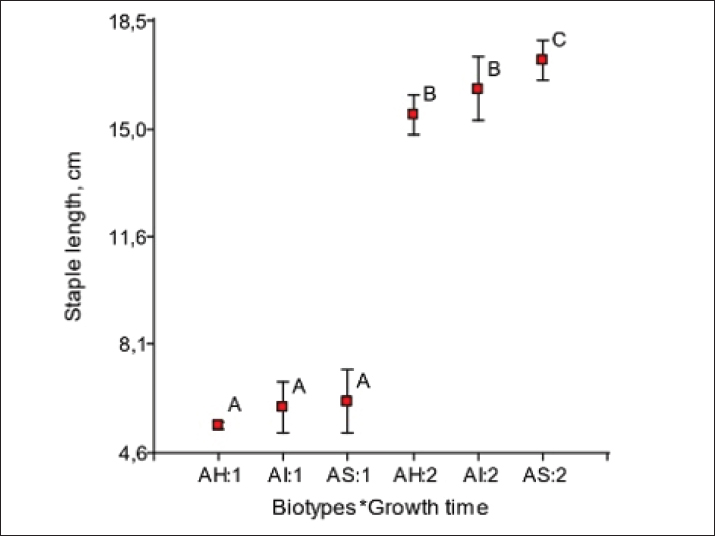
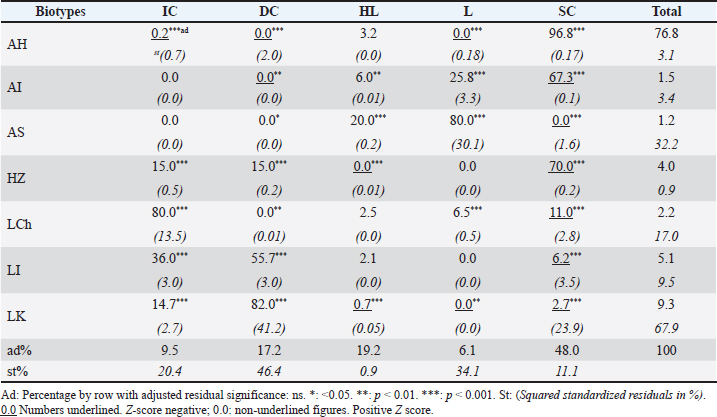
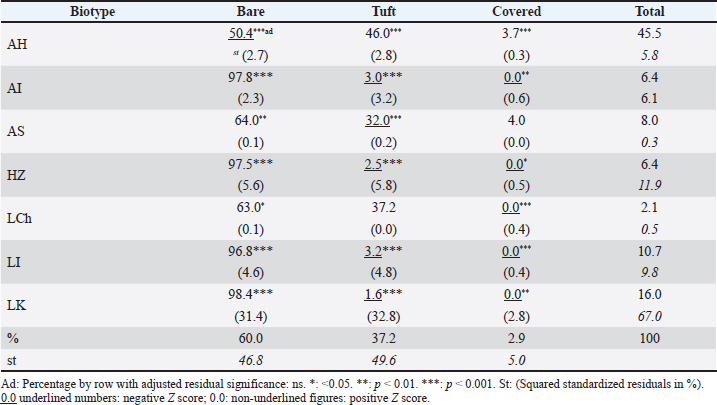
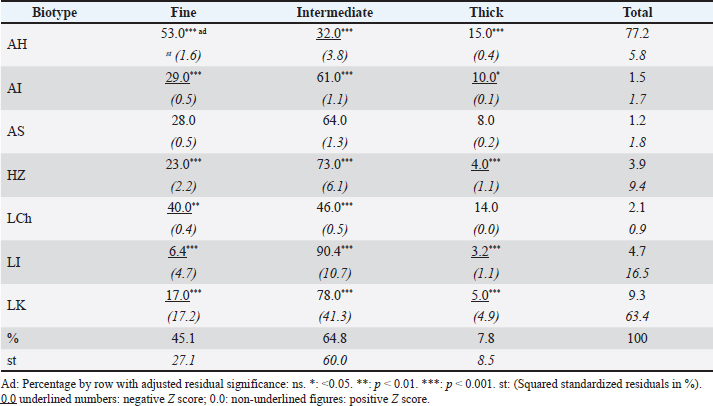
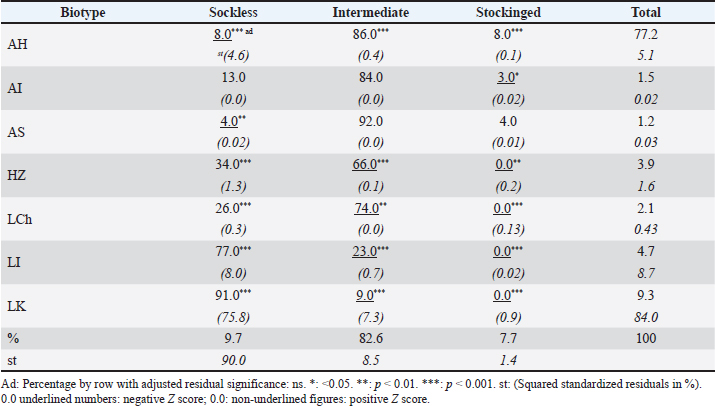
| How to Cite this Article |
| Pubmed Style Flores-gutiérrez A, Prieto A, Castillo M, Castillo MF, Frank EN. Fiber length and its phenotypic role in fleece coverage and genotype-based biotype identification in South American domestic camelids. Open Vet. J.. 2026; 16(7): 4194-4216. doi:10.5455/OVJ.2026.v16.i7.8 Web Style Flores-gutiérrez A, Prieto A, Castillo M, Castillo MF, Frank EN. Fiber length and its phenotypic role in fleece coverage and genotype-based biotype identification in South American domestic camelids. https://www.openveterinaryjournal.com/?mno=307053 [Access: June 30, 2026]. doi:10.5455/OVJ.2026.v16.i7.8 AMA (American Medical Association) Style Flores-gutiérrez A, Prieto A, Castillo M, Castillo MF, Frank EN. Fiber length and its phenotypic role in fleece coverage and genotype-based biotype identification in South American domestic camelids. Open Vet. J.. 2026; 16(7): 4194-4216. doi:10.5455/OVJ.2026.v16.i7.8 Vancouver/ICMJE Style Flores-gutiérrez A, Prieto A, Castillo M, Castillo MF, Frank EN. Fiber length and its phenotypic role in fleece coverage and genotype-based biotype identification in South American domestic camelids. Open Vet. J.. (2026), [cited June 30, 2026]; 16(7): 4194-4216. doi:10.5455/OVJ.2026.v16.i7.8 Harvard Style Flores-gutiérrez, A., Prieto, . A., Castillo, . M., Castillo, . M. F. & Frank, . E. N. (2026) Fiber length and its phenotypic role in fleece coverage and genotype-based biotype identification in South American domestic camelids. Open Vet. J., 16 (7), 4194-4216. doi:10.5455/OVJ.2026.v16.i7.8 Turabian Style Flores-gutiérrez, Alfonso, Alejandro Prieto, Melina Castillo, María Flavia Castillo, and Eduardo Narciso Frank. 2026. Fiber length and its phenotypic role in fleece coverage and genotype-based biotype identification in South American domestic camelids. Open Veterinary Journal, 16 (7), 4194-4216. doi:10.5455/OVJ.2026.v16.i7.8 Chicago Style Flores-gutiérrez, Alfonso, Alejandro Prieto, Melina Castillo, María Flavia Castillo, and Eduardo Narciso Frank. "Fiber length and its phenotypic role in fleece coverage and genotype-based biotype identification in South American domestic camelids." Open Veterinary Journal 16 (2026), 4194-4216. doi:10.5455/OVJ.2026.v16.i7.8 MLA (The Modern Language Association) Style Flores-gutiérrez, Alfonso, Alejandro Prieto, Melina Castillo, María Flavia Castillo, and Eduardo Narciso Frank. "Fiber length and its phenotypic role in fleece coverage and genotype-based biotype identification in South American domestic camelids." Open Veterinary Journal 16.7 (2026), 4194-4216. Print. doi:10.5455/OVJ.2026.v16.i7.8 APA (American Psychological Association) Style Flores-gutiérrez, A., Prieto, . A., Castillo, . M., Castillo, . M. F. & Frank, . E. N. (2026) Fiber length and its phenotypic role in fleece coverage and genotype-based biotype identification in South American domestic camelids. Open Veterinary Journal, 16 (7), 4194-4216. doi:10.5455/OVJ.2026.v16.i7.8 |